Table 1.
Results of percentage of inhibition of COX-1, and COX-2, IC50, selectivity COX-1/CO-2; percentage of inhibition of IL-6 (pg/ml), and TNF-α of the synthesized spirooxindoles based on benzo[b]furan scaffold 5a-r.
| # | Compound | COX-1% | COX-2% | COX-1 |
COX-2 |
Selectivityb IC50 COX-1/IC50 COX-2 |
IL-6 (pg/ml)% | TNF-α (pg/ml)% |
|---|---|---|---|---|---|---|---|---|
| IC50 (μM ± SD)a | ||||||||
| 1 |  |
57.38 | 11.24 | 20.42 ± 0.55 | 88.09 ± 1.78 | 23% | 57.38 | 51.24 |
| 2 |  |
27.36 | 9.81 | NDc | ND | ND | 27.36 | 9.81 |
| 3 |  |
40.81 | 8.33 | 37 ± 1.54 | 76.17 ± 1.46 | 49% | 59.81 | 48.33 |
| 4 |  |
19.81 | 7.77 | ND | ND | ND | 76.81 | 67.77 |
| 5 |  |
9.43 | 1.8 | ND | ND | ND | 82.43 | 71.8 |
| 6 |  |
32.08 | 5.92 | ND | ND | ND | 63.08 | 55.92 |
| 7 |  |
19.81 | 2.76 | ND | ND | ND | 81.81 | 78.76 |
| 8 |  |
41.70 | 9.8 | 35.70 ± 0.51 | 84.66 ± 1.16 | 42% | 38.70 | 49.8 |
| 9 |  |
44.53 | 17.85 | 29.55 ± 0.19 | 71.25 ± 1.29 | 41% | 62.53 | 57.85 |
| 10 |  |
21.70 | 7.89 | ND | ND | ND | 77.70 | 67.89 |
| 11 |  |
12.26 | 4.45 | ND | ND | ND | 87.26 | 74.45 |
| 12 | 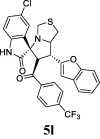 |
47.74 | 19.78 | 31.25 ± 0.24 | 58.75 ± 1.58 | 36% | 42.74 | 39.78 |
| 13 | 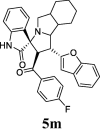 |
20.75 | 5.78 | ND | ND | ND | 79.54 | 75.78 |
| 14 | 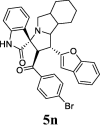 |
9.43 | 1.11 | ND | ND | ND | 82.12 | 77.11 |
| 15 | 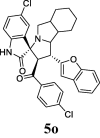 |
29.25 | 6.11 | ND | ND | ND | 76.81 | 66.11 |
| 16 | 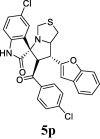 |
52.75 | 9.98 | 38.24 ± 0.96 | 85.70 ± 1.51 | 45% | 47.18 | 39.98 |
| 17 | 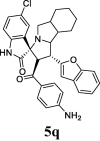 |
32.08 | 10.1 | ND | ND | ND | 67.43 | 60.1 |
| 18 | 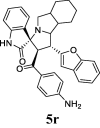 |
32.08 | 6.91 | ND | ND | ND | 64.81 | 62.91 |
| STD | Indomethacin | 87.31 | 18.76 | 0.24 ± 0.05 | 3.28 ± 0.09 | 7% | 7.7 | 8.1 |
| Acetyl-keto boswellic acid | 71.42 | 19.87 | 7.84 ± 0.13 | 82.52 ± 0.62 | 10% | 7.31 | 18.76 | |
| Acetyl-β-boswellic acid | 75.73 | 14.87 | 8.16 ± 0.10 | 72.52 ± 0.51 | 11% | 11.42 | 19.87 | |
| Acetyl-α-boswellic acid | 69.81 | 7.98 | 10.13 ± 0.17 | >100 | 10% | 15.73 | 14.87 | |
| β-Boswellic acid | 64.77 | 7.66 | 18.14 ± 0.42 | >100 | 18% | 19.81 | 27.98 | |
| Celecoxib | 8.7 | 92 | 29.19 ± 0.33 | 0.08 ± 0.44 | 365% | 24.77 | 25.16 | |
| Lipopolysaccharide (LPS) | – | – | – | – | – | 100 | 100 | |
COX-1, and COX-2 inhibitory activity is expressed as the mean ± SD of triplicate experiments. bSelectivity is defined as IC50 COX-1/IC50 COX-2. cND: not determined.
