
Fig. 8.
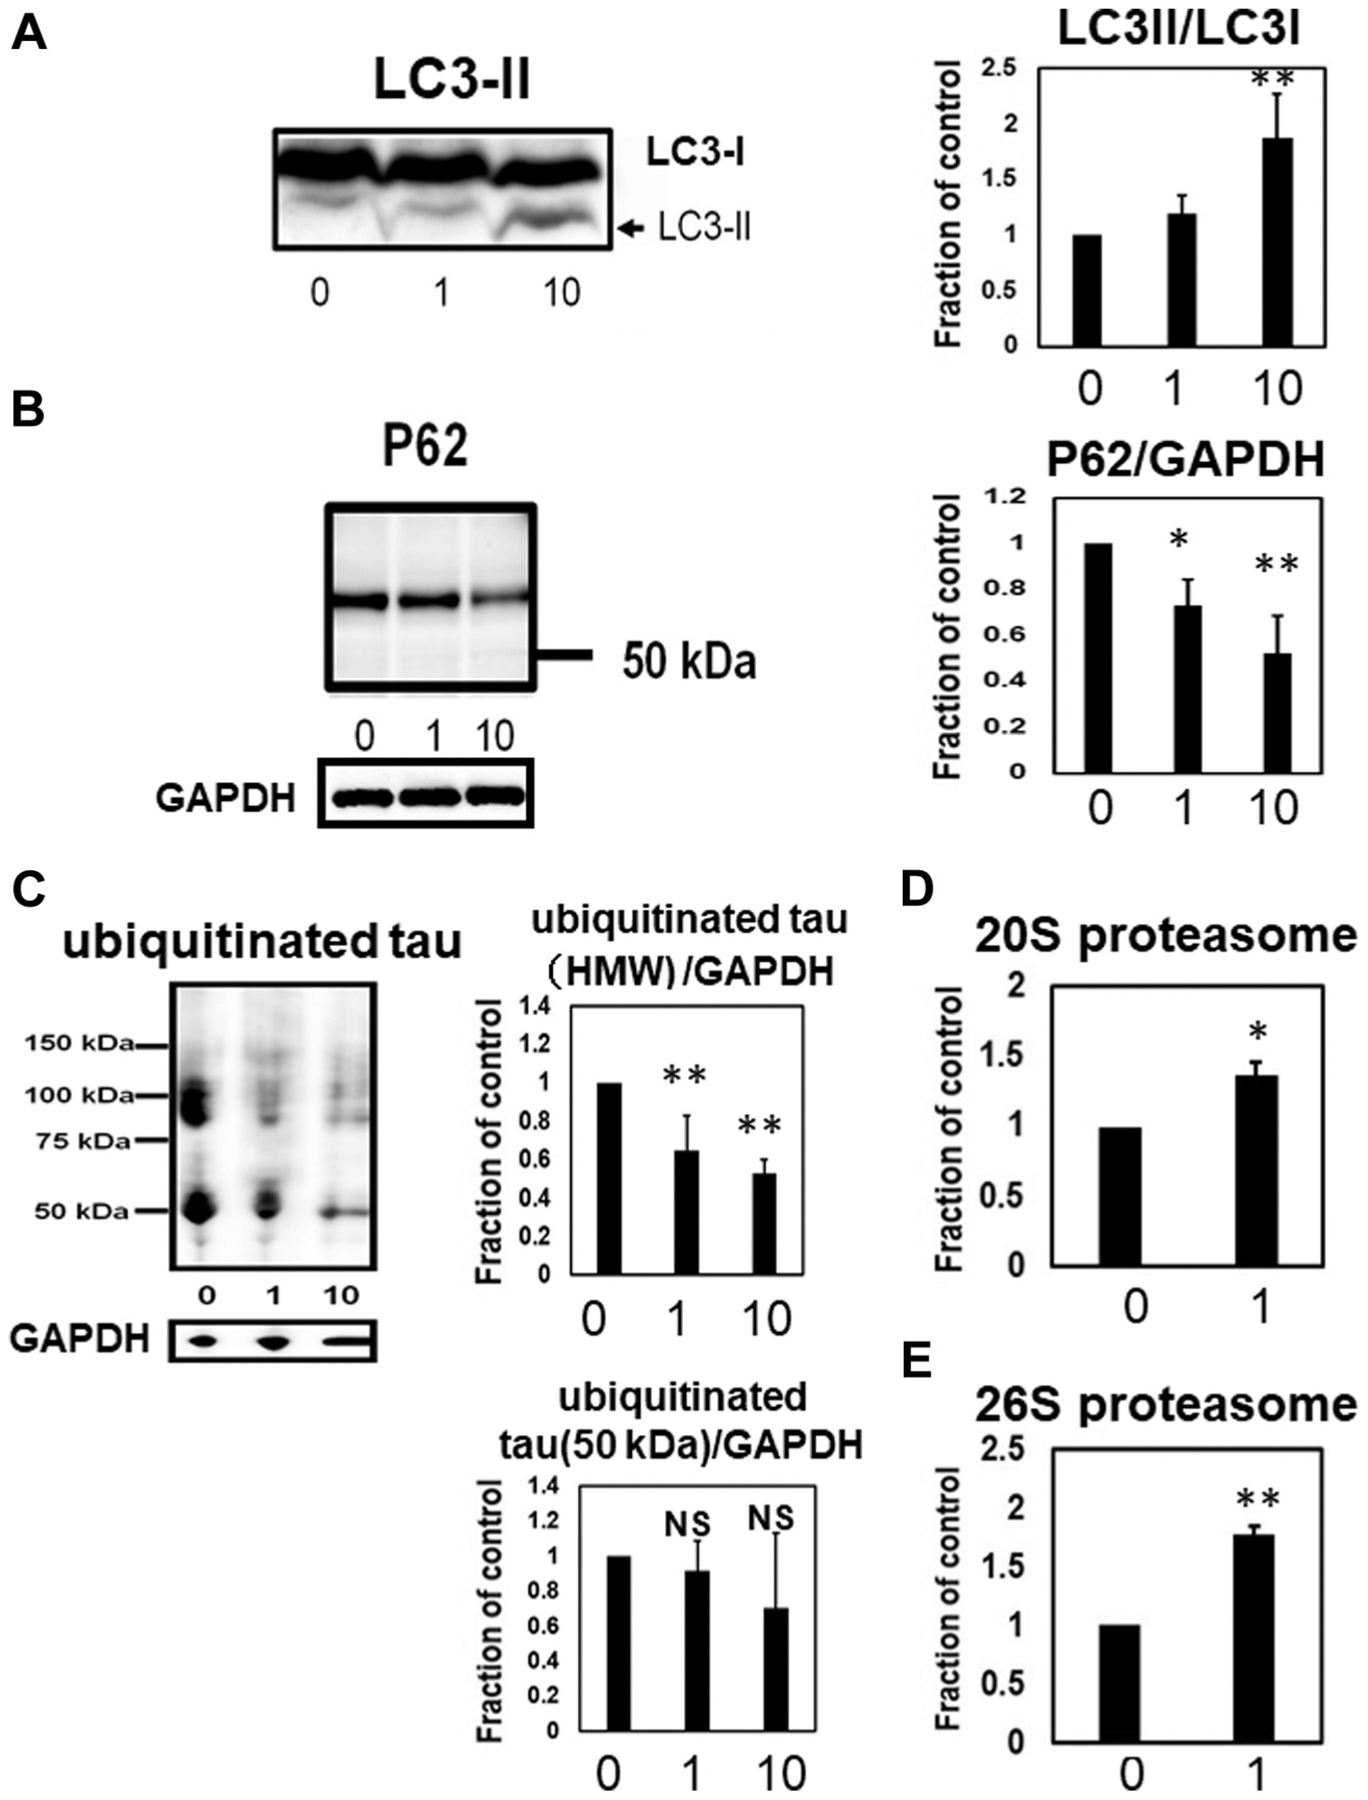
The ROCK inhibitor (H1152) activated autophagy and proteasome (20S and 26S). LC3-II, which is the marker of autophagy, was upregulated by ROCK inhibitor (10 μM) treatment. N = 4, **p < 0.01, Bar: ± SD (A). P62, which is one of the substrates of autophagy, was decreased by ROCK inhibitor treatment. N = 4, **p < 0.01, *p < 0.05, Bar: ± SD (B). ROCK inhibitor treatment reduced the amount of ubiquitinated tau protein, suggesting that the proteasomal system was upregulated by the ROCK inhibitor. N = 3, **p < 0.01, Bar: ± SD. (C). Chymotrypsin-like 20S proteasomal activity (N = 3) *p < 0.05, Bar: ± SD (D), and trypsin-like 26S proteasomal activity (N = 3), **p < 0.01, Bar: ± SD (E) were also upregulated by the ROCK inhibitor. Data from LC3-II/LC3-I, P62/GAPDH, and ubiquitinated high molecular weight tau followed a normal distribution and were analyzed with one-way ANOVA followed by Bonferroni post hoc test, whereas the Kruskal-Wallis test followed by Dunn’s post hoc test was used for 50 kDa ubiquitinated tau because the data deviated from a normal distribution. The Chymotrypsin-like 20S proteasomal activity and trypsin like 26S proteasomal activity data followed a normal distribution and were analyzed with Student’s t-test. Abbreviations: GAPDH, glyceraldehyde 3-phosphate dehydrogenase; NS, not significant; ROCK, Rho-associated coiled-coil protein kinase, LC3, microtubule-associated protein 1 light chain 3.