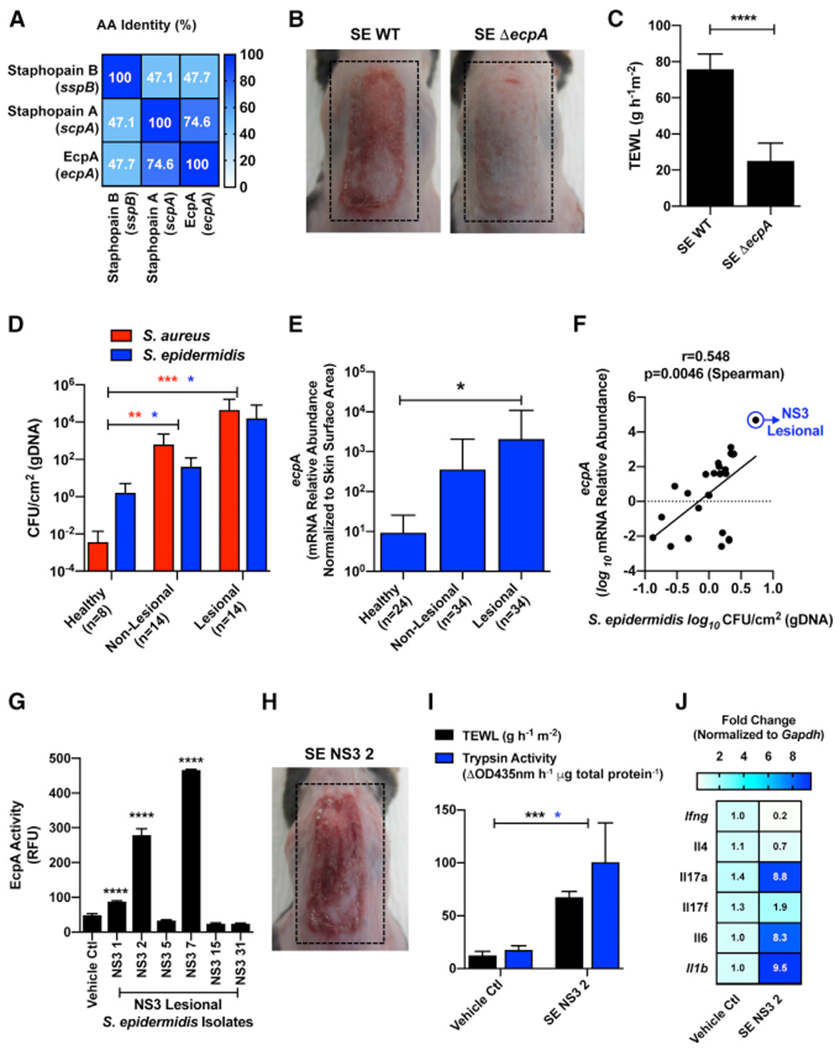
Figure 5. Staphylococcus epidermidis Colonization Is Increased in Netherton Syndrome Skin and Can Induce Epithelial Barrier Damage through the Expression of the Cysteine Protease EcpA.

(A) Percentage amino acid sequence identity of the mature forms of the two S. aureus secreted cysteine proteases staphopain A (scpA) and staphopain B (sspB) and the S. epidermidis secreted cysteine protease EcpA (ecpA).
(B and C) (B) Representative pictures and (C) TEWL measurement of female C57BL/6J murine back skin after epicutaneous application of 1e7 CFU/cm2 of S. epidermidis (SE) wild-type (WT) or SE ecpA knockout (ΔecpA) strains for 48h (n = 5 per group). Results represent mean ± SEM, and Student’s t test was used to determine statistical significance: *p < 0.05, **p < 0.01, ***p < 0.001, and ****p < 0.0001.
(D) Measurement of gDNA absolute abundance of S. epidermidis (blue bars) and S. aureus (red bars) CFU/cm2 on NS (non-lesional and lesional) versus healthy skin (n, number of individual skin swabs per condition). Results represent mean ± SEM, and a non-parametric unpaired Kruskal-Wallis test was used to determine statistical significance: *p < 0.05, **p < 0.01, ***p < 0.001, and ****p < 0.0001.
(E) Relative abundance of S. epidermidis ecpA mRNA isolated from swabs of healthy control and NS non-lesional and lesional skin normalized to skin area (n, number of individual skin swabs per condition). Results represent mean ± SEM, and a non-parametric unpaired Kruskal-Wallis test was used to determine statistical significance: *p < 0.05, **p < 0.01, ***p < 0.001, and ****p < 0.0001.
(F) Spearman correlation between the relative abundance of S. epidermidis ecpA mRNA and S. epidermidis CFU/cm2 (gDNA) from skin swabs.
(G) Assessment of subject NS3 isolated S. epidermidis isolates from lesional skin swabs for specific cleavage of EcpA substrate (n = 3). Results represent mean ± SEM, and a one-way ANOVA was used to determine statistical significance: *p < 0.05, **p < 0.01, ***p < 0.001, and ****p < 0.0001.
(H) Representative picture of murine back skin after 48 h colonization with 1e7 CFU/cm2 of clinical S. epidermidis isolate NS3 2 (SE. NS3 2).
(I and J) Analysis of epidermal barrier damage (TEWL), trypsin activity, and qPCR analysis of inflammatory cytokines stimulated in murine skin by S. epidermidis isolate SE. NS3 2. qPCR cytokine levels (Ifng, Il4, Il17a, Il17f, Il6, and Il1b) are normalized to the housekeeping gene Gapdh.
In (B), (C), and (G)–(J), data are representatives of at least two independent experiments. See also Figures S5 and S6.
