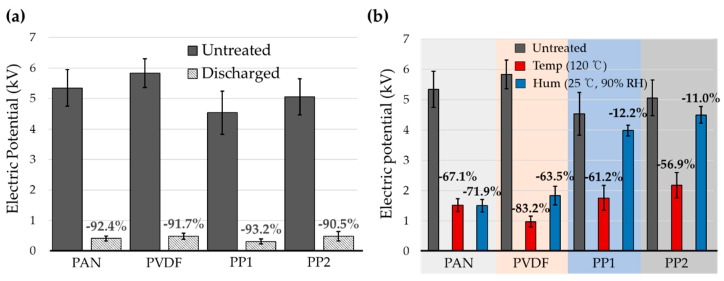
Figure 3.
Electric potential measured for electret filters under various conditions. (a) Comparison of electric field from electret filter and discharged filter; (b) electric potential of electret filters before and after aging. Numerical values above the bar chart are the reduction (%) of electric potential for treatments, compared to the untreated filters.

