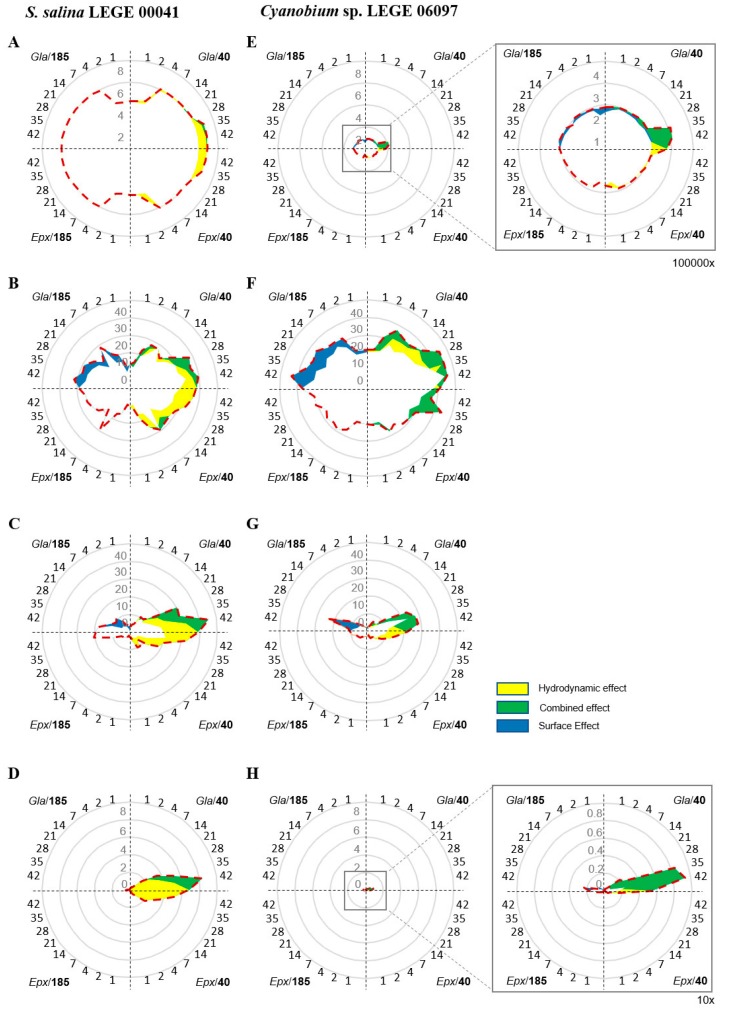
Figure 3.
Radar charts representing (A and E) the number of biofilm cells (Log cells.cm−2), (B and F) biofilm wet weight (mg), (C and G) biofilm thickness (µm), and (D and H) chlorophyll a content (µg·cm−2), for S. salina LEGE 00041 and Cyanobium sp. LEGE 06097. Average values (previously represented in Figure 1 and Figure 2) are plotted as a dashed line considering the time scale (days) indicated in each quadrant. The following conditions are depicted in each quadrant: Q1: Gla/40 glass at 40 rpm; Q2: Epx/40 epoxy-coated glass at 40 rpm; Q3: Epx/185 epoxy-coated glass at 185 rpm; and Q4: Gla/185 glass at 185 rpm. The hydrodynamic effect calculated by subtracting the values obtained at different shear forces for both glass (Q1 vs. Q4) and epoxy-coated glass (Q2 vs. Q3) is represented by the yellow area. The surface effect determined by subtracting the values obtained for two different surfaces at lower shear (Q1 vs. Q2) and higher shear (Q4 vs. Q3) is represented by the blue area. When these effects overlap, they are represented by the green area. Only positive differences are represented.

