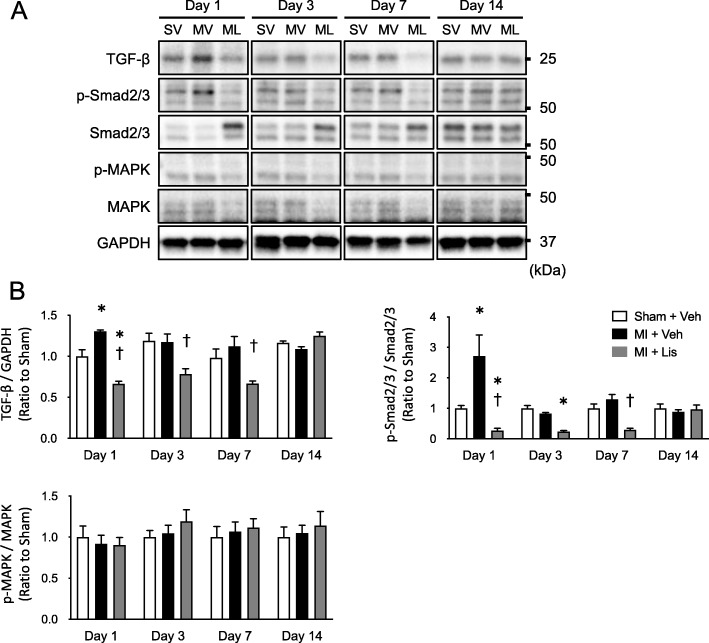
Fig. 4.
Signal pathway inducing skeletal muscle fibrosis after MI. a Representative immunoblotting bands in gastrocnemius muscle obtained from the 3 groups. The sizes of the molecular weight markers are indicated on the right in kilo Dalton. b Summarized data of protein expression of TGF-β, p-Smad/Smad, and p-MAPK/MAPK. GAPDH was used as an internal control. Data are expressed as the mean ± SE. *P < 0.05 vs. Sham + Veh, †P < 0.05 vs. MI + Veh. TGF-β, transforming growth factor beta; MAPK, mitogen-activated protein kinase. Data are expressed as the mean ± SE. *P < 0.05 vs. Sham, †P < 0.05 vs. MI. SV, Sham + Vehicle; MV, MI + Vehicle, ML, MI + Lisinopril; TGF-β, transforming growth factor beta; MAPK, mitogen-activated protein kinase

