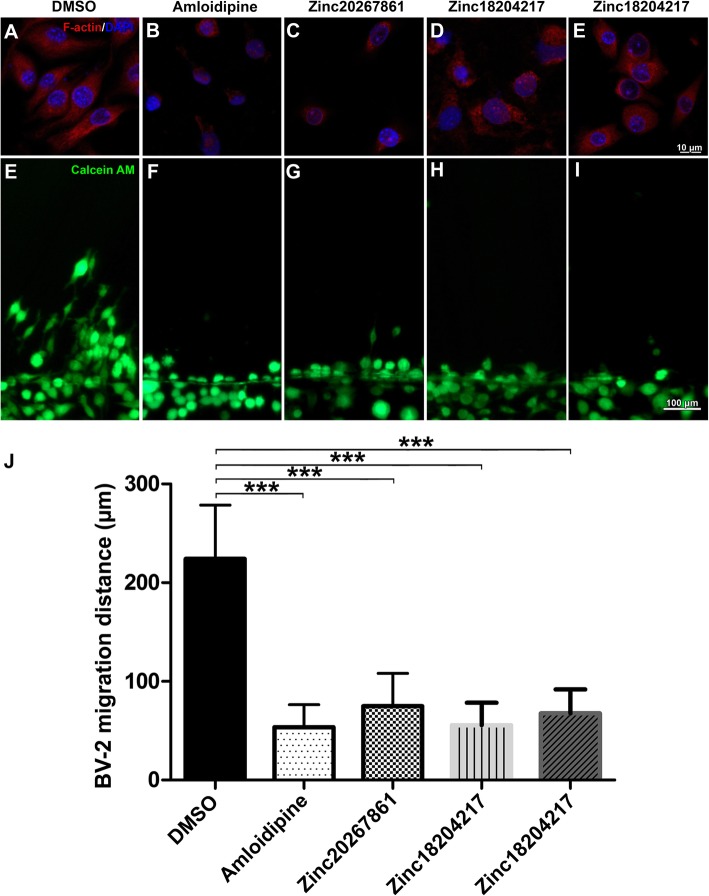
Fig. 4.
BV-2 cells F-actin expression, structure, and migration capacity affected by L-VGCC blockade. F-actin staining reveal cytoskeleton structure (a–e) and migration capacity in scratch assay as demonstrated by vital Calcein AM staining in BV-2 cells (e–i) with DMSO control treatment (2 μl/ml) (a, e), Amlodipine (3.5 μM) (b, f), Zinc20267861 (2.0 μM) (c, g), Zinc18204217 (2.0 μM) (d, h), and Zinc33254827 (2.5 μM) (e, i). Quantification of BV-2 cells migration distance (n = 4) (j). One-way ANOVA test with Tukey multiple comparisons was used to determine statistical significance. ***p < 0.001

