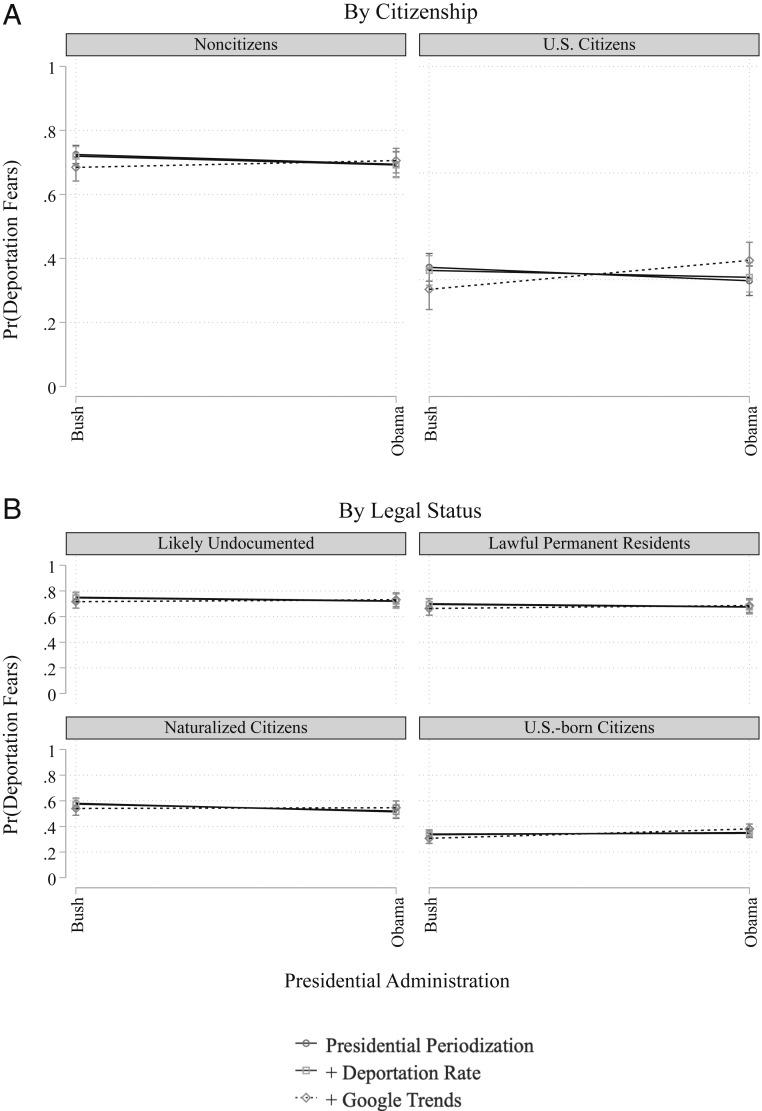
Fig. 6.
Adjusted predicted probabilities of Latinos reporting deportation fears by (A) citizenship and (B) legal status, 2007 to 2018. Notes: Bush administration includes 2007 and 2008 survey. Obama administration includes 2010, 2013, and 2016 survey. Trump administration excluded due to limited time series. The vertical bars represent 95% confidence intervals based on linearized SEs. Missing data are imputed using chained equations. Deportation fears question asks: “Regardless of your own immigration or citizenship status, how much, if at all, do you worry that you, a family member, or a close friend could be deported? Would you say that you worry a lot, some, not much, or not at all?” Respondents answering “a lot” and “some” are combined into a single category; those answering “not much” and “not at all” are also combined. Controls include: age, sex, educational attainment, political party, the number of adults in a respondent’s household, the geographic region in which the respondent completed the survey, the presidential administration, and an interaction term between legal status and the presidential administration. Source: Author’s analysis of 2007, 2008, 2010, 2013, 2016, and 2018 National Survey of Latinos from Pew Hispanic Center.

