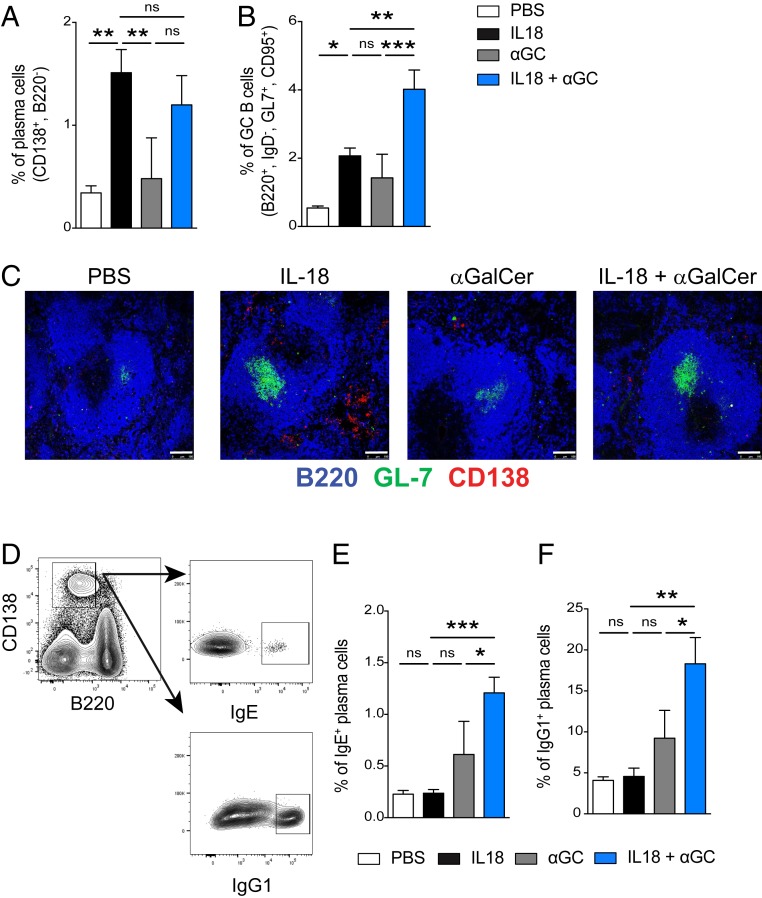
Fig. 2.
αGalCer promotes germinal center formation during chronic inflammation. (A and B) Percent of (A) plasma cells (CD138+, B220−) and (B) germinal center B cells (IgD−, B220+, GL-7+, CD95+) in the spleen 12 d after in vivo stimulation with the indicated treatments. (C) Immunofluorescence microscopy of the spleen (day 12; mice are treated as indicated) stained with B220 (blue), GL-7 (green), and CD138 (red). (Scale bars, 100 μm.) (D) Representative plots of intracellular IgE and IgG1 staining of splenic plasma cells on day 12. (E and F) Percent of (E) IgE+ and (F) IgG1+ CD138+ B220− plasma cells in the spleen of mice on day 12 of treatment as identified in the key. Representative plots are from two to four experiments, n = 3 to 5 mice per group. One-way ANOVA was employed to assess statistical differences. *P < 0.05, **P < 0.005, ***P < 0.0001. Graphs display group mean ± SEM.

