Fig. 3.
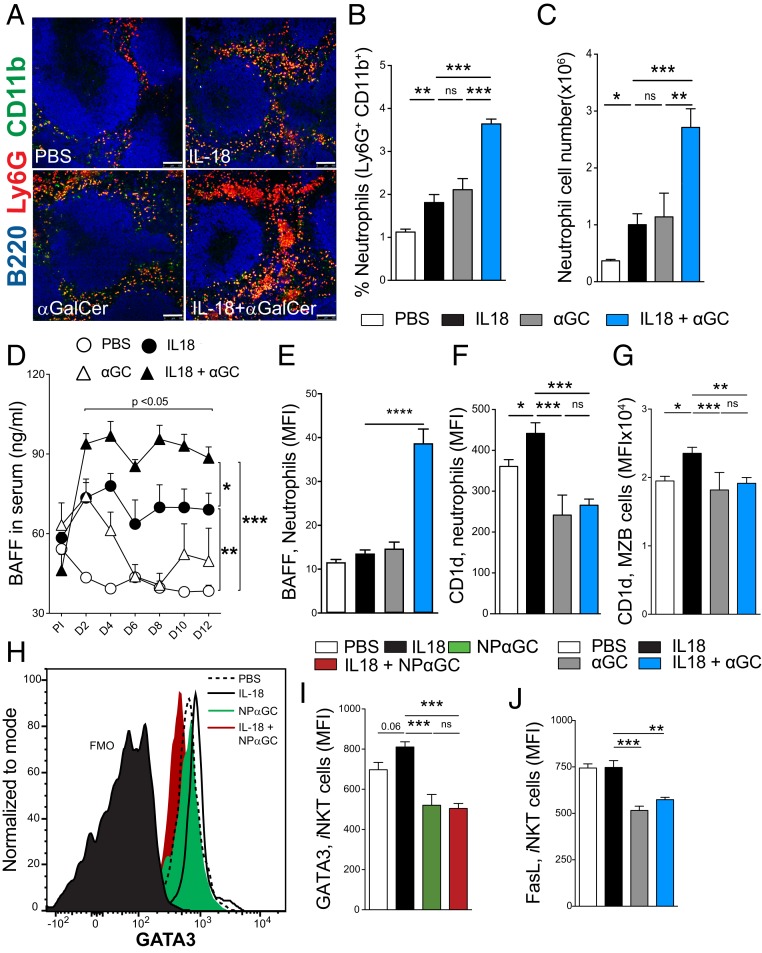
Neutrophil licensing of iNKT cells is inhibited by αGalCer during IL-18–mediated chronic inflammation. (A) Immunofluorescence microscopy of the spleen (day 12) with B220 (blue), CD11b (green), and Ly6G (red). (Scale bars, 100 μm.) (B and C) Percent (B) and total cell number (C) of neutrophils (Ly6G+, CD11b+) in the spleen. (D) Serum BAFF measured by ELISA. (E–G) Median fluorescence intensity (MFI) of (E) BAFF and (F) CD1d expression on neutrophils and (G) CD1d on MZB cells. (H–J) iNKT cell (TCRb+, CD1d TET [PBS-57]+) GATA3 (H) representative flow cytometry plot and (I) summary of GATA3 (MFI) and (J) FasL expression. One-way (B, C, E–G, I, and J) or two-way ANOVA with Tukey’s correction for multiple comparisons (D). *P < 0.05, **P < 0.005, ***P < 0.001, ****P < 0.0001. Graphs display group mean ± SEM. Pooled data from four experiments are shown in B (PBS [n = 13], IL-18 [n = 14], αGC [n = 10], and IL-18 + αGC [n = 15]). C, D, F, and I show representative data from three experiments (n = 3 to 5 per group). E shows data from one experiment (n = 6 per group).

