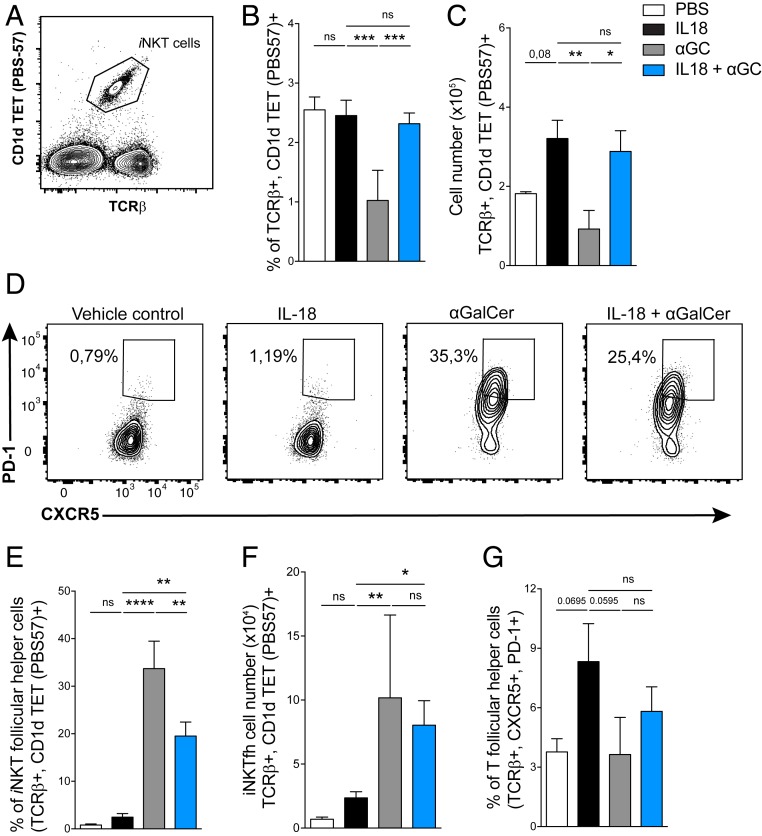
Fig. 4.
Activation of iNKT cells with IL-18 + αGalCer induces an iNKT follicular helper phenotype. (A) Representative flow cytometry plot for iNKT cells stained with TCR and CD1d tetramer (PBS-57). (B and C) iNKT cell (B) percent and (C) total cell count on day 12 in the spleen. (D–F) Analysis of iNKTfh cells (TCR+ CD1d TET+, PD-1hi, CXCR5hi). (D) Representative flow cytometry plots, (E) percent, and (F) total cell number. (G) Percent of conventional, CD4+ T follicular helper cells. Data are representative of four experiments (n = 4 or 5 mice per group). One-way ANOVA; *P < 0.05, **P < 0.005, ***P < 0.001, ****P < 0.0001. Graphs display group mean ± SEM.

