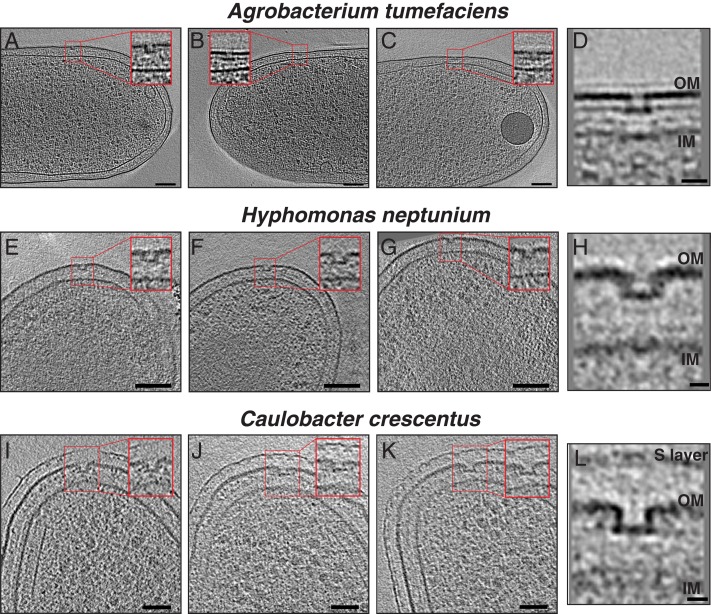
Fig. 3.
Cryo-ET of the Alphaproteobacteria species. (A–C) Slices through electron cryo-tomograms of A. tumefaciens highlighting the presence of flagellar disassembly PL-subcomplexes with zoom-ins (Insets) of these subcomplexes present in the red squares. (Scale bars: 100 nm.) (D) Central slice through a subtomogram average of PL-subcomplexes in A. tumefaciens. (Scale bar: 20 nm.) (E–G) Same as in A–C, but for H. neptunium. (Scale bars: 100 nm.) (H) Central slice through a subtomogram average of PL-subcomplexes in H. neptunium. (Scale bar: 10 nm.) (I–K) Same as in A–C, but for C. crescentus. (Scale bars: 50 nm.) (L) Central slice through a subtomogram average of PL-subcomplexes in C. crescentus. (Scale bar: 10 nm.) IM, inner membrane; OM, outer membrane.

