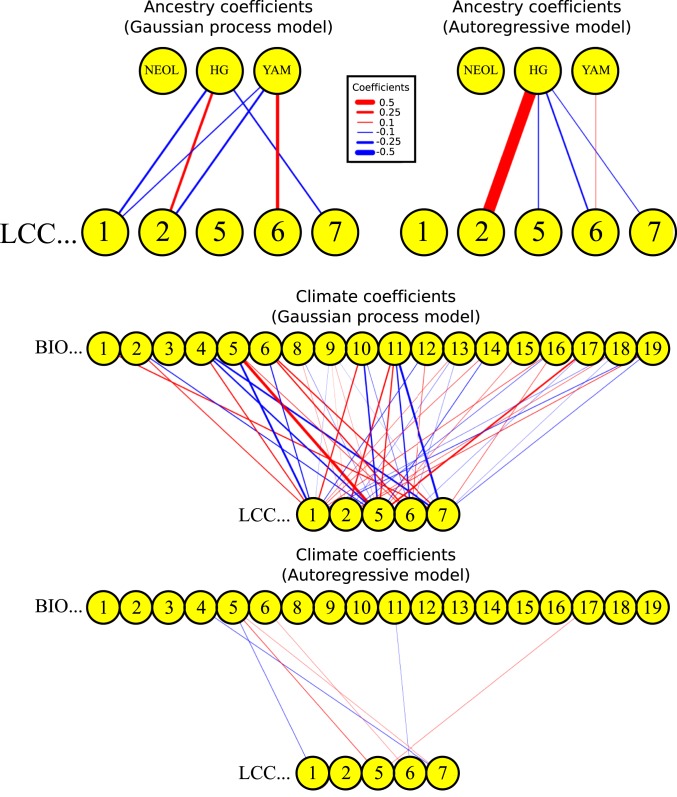
Fig. 7.
Posterior mean coefficients of spatiotemporal model for paleovegetation anomalies, using kriged ancestry anomalies and anomalies from simulation-based paleoclimate reconstructions as explanatory variables. (Top Left and Middle) Posterior coefficients from GP model. (Top Right and Bottom) Coefficients from autoregressive model. Coefficients whose corresponding posterior distribution has a central probability mass interval that spans the value of 0 are not depicted. LCC1, needle-leaf forest; LCC2, broad-leaf forest; LCC5, heath/scrubland; LCC6, pasture/natural grassland; LCC7, arable/disturbed land. The climate variables follow the WorldClim nomenclature. BIO1, Annual Mean Temperature; BIO2, Mean Diurnal Range (Mean of monthly (max temp – min temp)); BIO3, Isothermality (BIO2/BIO7) (× 100); BIO4, Temperature Seasonality (SD × 100); BIO5, Max Temperature of Warmest Month; BIO6, Min Temperature of Coldest Month; BIO8, Mean Temperature of Wettest Quarter; BIO9, Mean Temperature of Driest Quarter; BIO10, Mean Temperature of Warmest Quarter; BIO11, Mean Temperature of Coldest Quarter; BIO12, Annual Precipitation; BIO13, Precipitation of Wettest Month; BIO14, Precipitation of Driest Month; BIO15, Precipitation Seasonality (Coefficient of Variation); BIO16, Precipitation of Wettest Quarter; BIO17, Precipitation of Driest Quarter; BIO18, Precipitation of Warmest Quarter; BIO19, Precipitation of Coldest Quarter.

