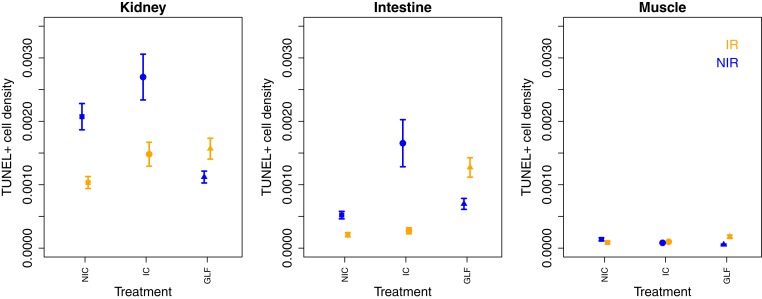
Fig. 3.
Density of TUNEL+ cells in three somatic tissues, two fast proliferating tissues (kidney and intestine) and one slow proliferating tissue (muscle) of males from three treatments (GLF, IC, and NIC) with (IR) and without (NIR) irradiation. Values displayed represent mean ± SE. Tunel+ density differed significantly across treatments and tissues (irradiation: χ21 = 693.22, P < 0.001; treatment: χ22 = 26.65, P < 0.001; dpir: χ25 = 207.32, P = 0.001, treatment*irradiation: χ22 = 50.17, P < 0.001, irradiation*dpir: χ25 = 26.34, P < 0.001, treatment*dpir: χ21 = 26.34, P < 0.001; see SI Appendix, Table S5 for complete model).

