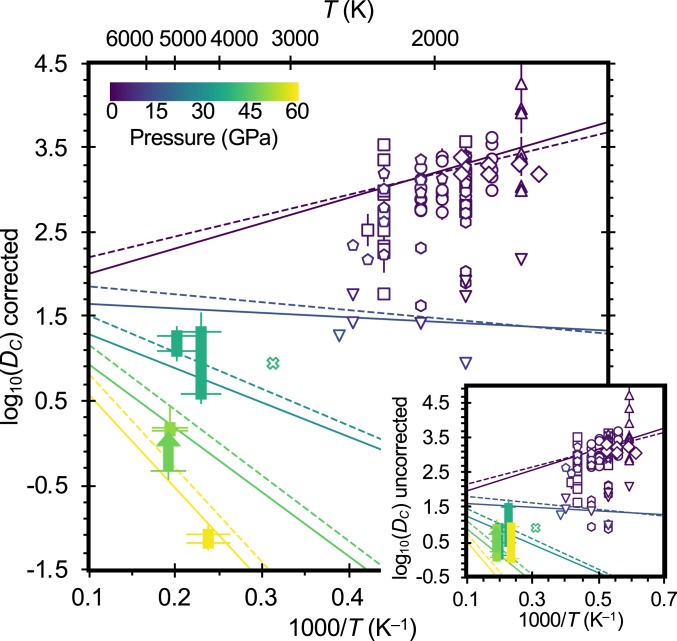
Fig. 2.
Metal–silicate partition coefficients of carbon from this study (solid rectangles) and previous studies (open symbols; Dataset S1). Data are color-coded by pressure and are corrected to a common NBO/T = 2.6, XO = XS = 0, and fO2 = IW–2.2 using Eq. 2 (or Eq. 1 for the nanoSIMS data from this study). Triangles: 14. Circles: 15. Squares: 8. Hexagons: 16. Stars: 17. Pentagons: 18. Inverted triangles: 19. Diamonds: 20. × symbol: ab initio calculation (26, uncorrected). Data from this study are shown as ranges encompassing microprobe and nanoSIMS analyses of carbon in the silicate glass (one datum only has a lower bound, shown as an arrow). Solid lines: fit to complete dataset, using nanoSIMS analyses for silicate C from the present study (Eq. 1). Dashed lines: fit to complete dataset, using microprobe analyses for silicate C from the present study (Eq. 2). Curves are shown for NBO/T = 2.6, XO = XS = 0, fO2 = IW–2.2, and pressures of 0, 15, 30, 45, and 60 GPa. (Inset) Uncorrected metal–silicate partition coefficients.

