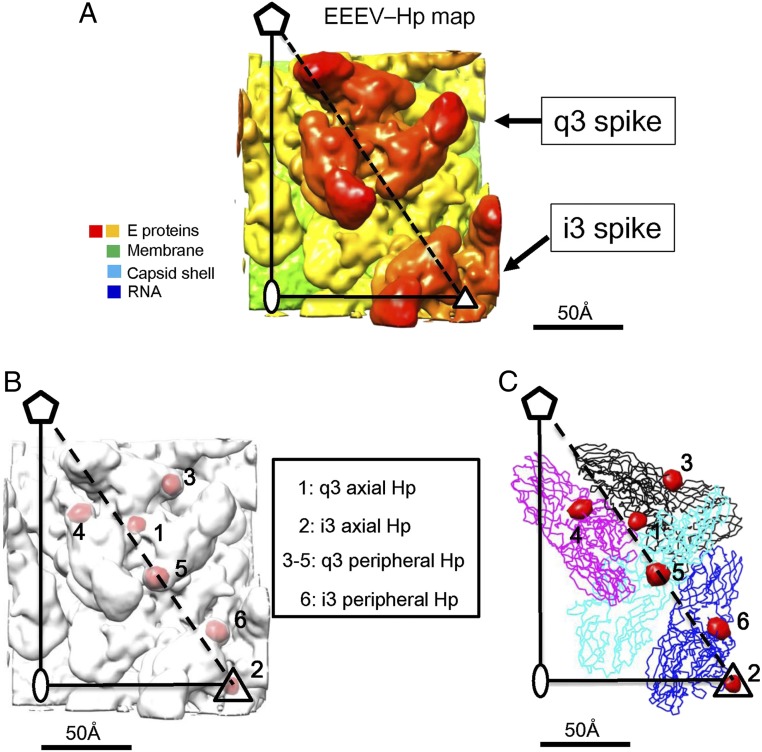
Fig. 2.
Identification of HS binding sites in an asymmetric unit of the EEEV viral particle. (A) The cryo-EM map of EEEV–Hp is shown in radial coloring from yellow (∼250 Å) to red (∼350 Å). (B) The superposition of the difference map (red) and the EEEV–Hp map (white). The larger difference densities were located at the axial sites (labeled 1 and 2) and peripheral sites (labeled 3 to 5) around the q3 spike and 6 at the i3 spike. (C) The superposition of the difference map (red blobs) and the structures of the E1–E2 glycoproteins represented as ribbon drawings. The four E1–E2 heterodimers are colored black, magenta, cyan, and blue. These were fitted into the EEEV–Hp cryo-EM map using the EMfit program (31, 32).

