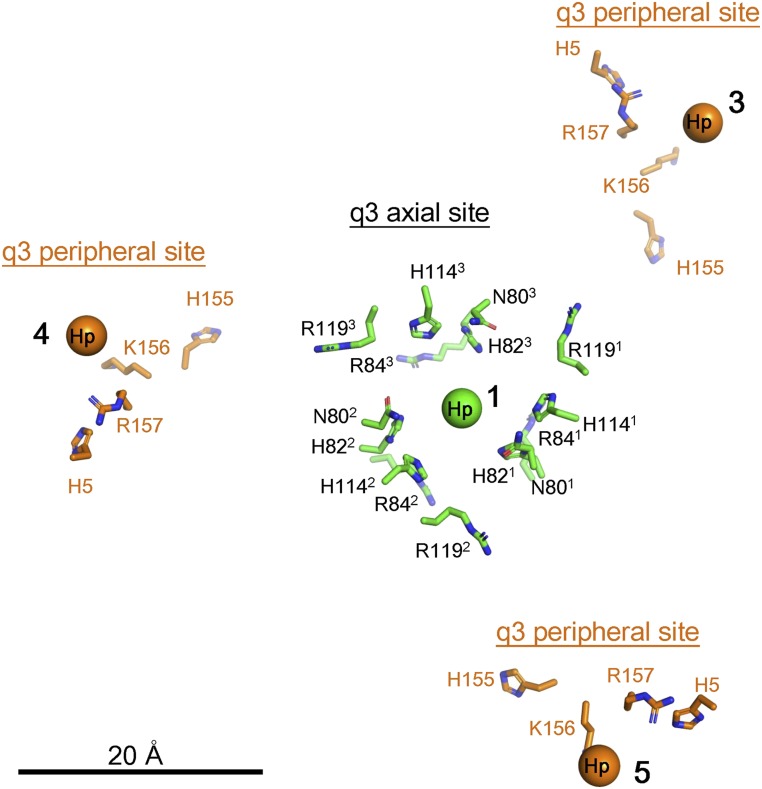
Fig. 3.
HS binding environment at the axial and peripheral HS sites. The q3 axial sites are labeled in black, and the q3 peripheral sites are labeled in orange. The center of the axial HS density (labeled 1) is shown as a green sphere. The side chains of the residues in the axial site are shown in green. The center of the peripheral Hp densities (labeled 3, 4, and 5) are shown as orange spheres, and the side chains of the residues, H5, H155, K156, and R157 of E2 are shown in orange.

