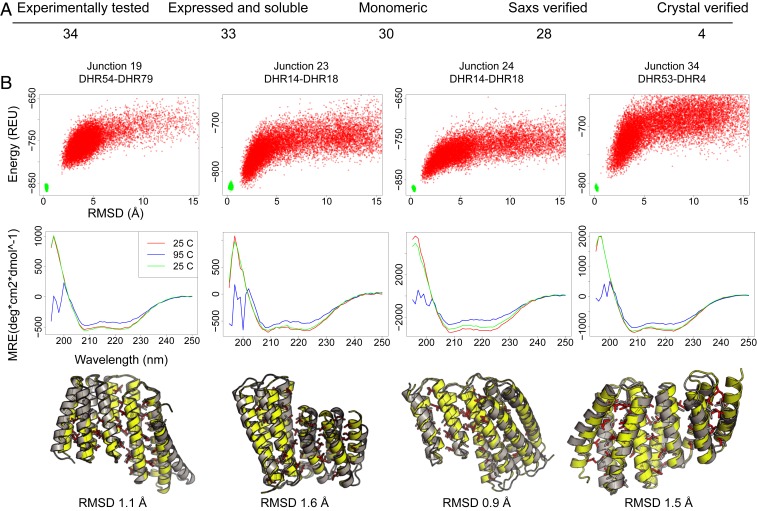
Fig. 2.
Experimental characterization of the designed junctions. (A) Numbers of designs at each characterization stage; the overall success rate through the SAXS stage is 82%. (B) Representative data for the four crystallized designs. Top row, junction names. Second row, the energy landscapes from Rosetta@home simulations. The y axis is energy as Rosetta energy units (REU; roughly 1 kcal/mol), and the x axis is the rmsd to the design. Third row, circular dichroism spectra collected at 25 °C (red), 95 °C (blue), and then cooled to 25 °C (green). All four proteins are stable to 95 °C. Bottom row, comparison of crystal structure to designed protein. In yellow and red are the backbone and side chains of the design; in gray is the crystal structure. Crystal structures have been deposited in the Protein data bank with the accession numbers 6W2R (Junction 19), 6W2V (Junction 23), 6W2W (Junction 24), and 6W2Q (Junction 34) (21–24). MRE, molar residue ellipticity.

