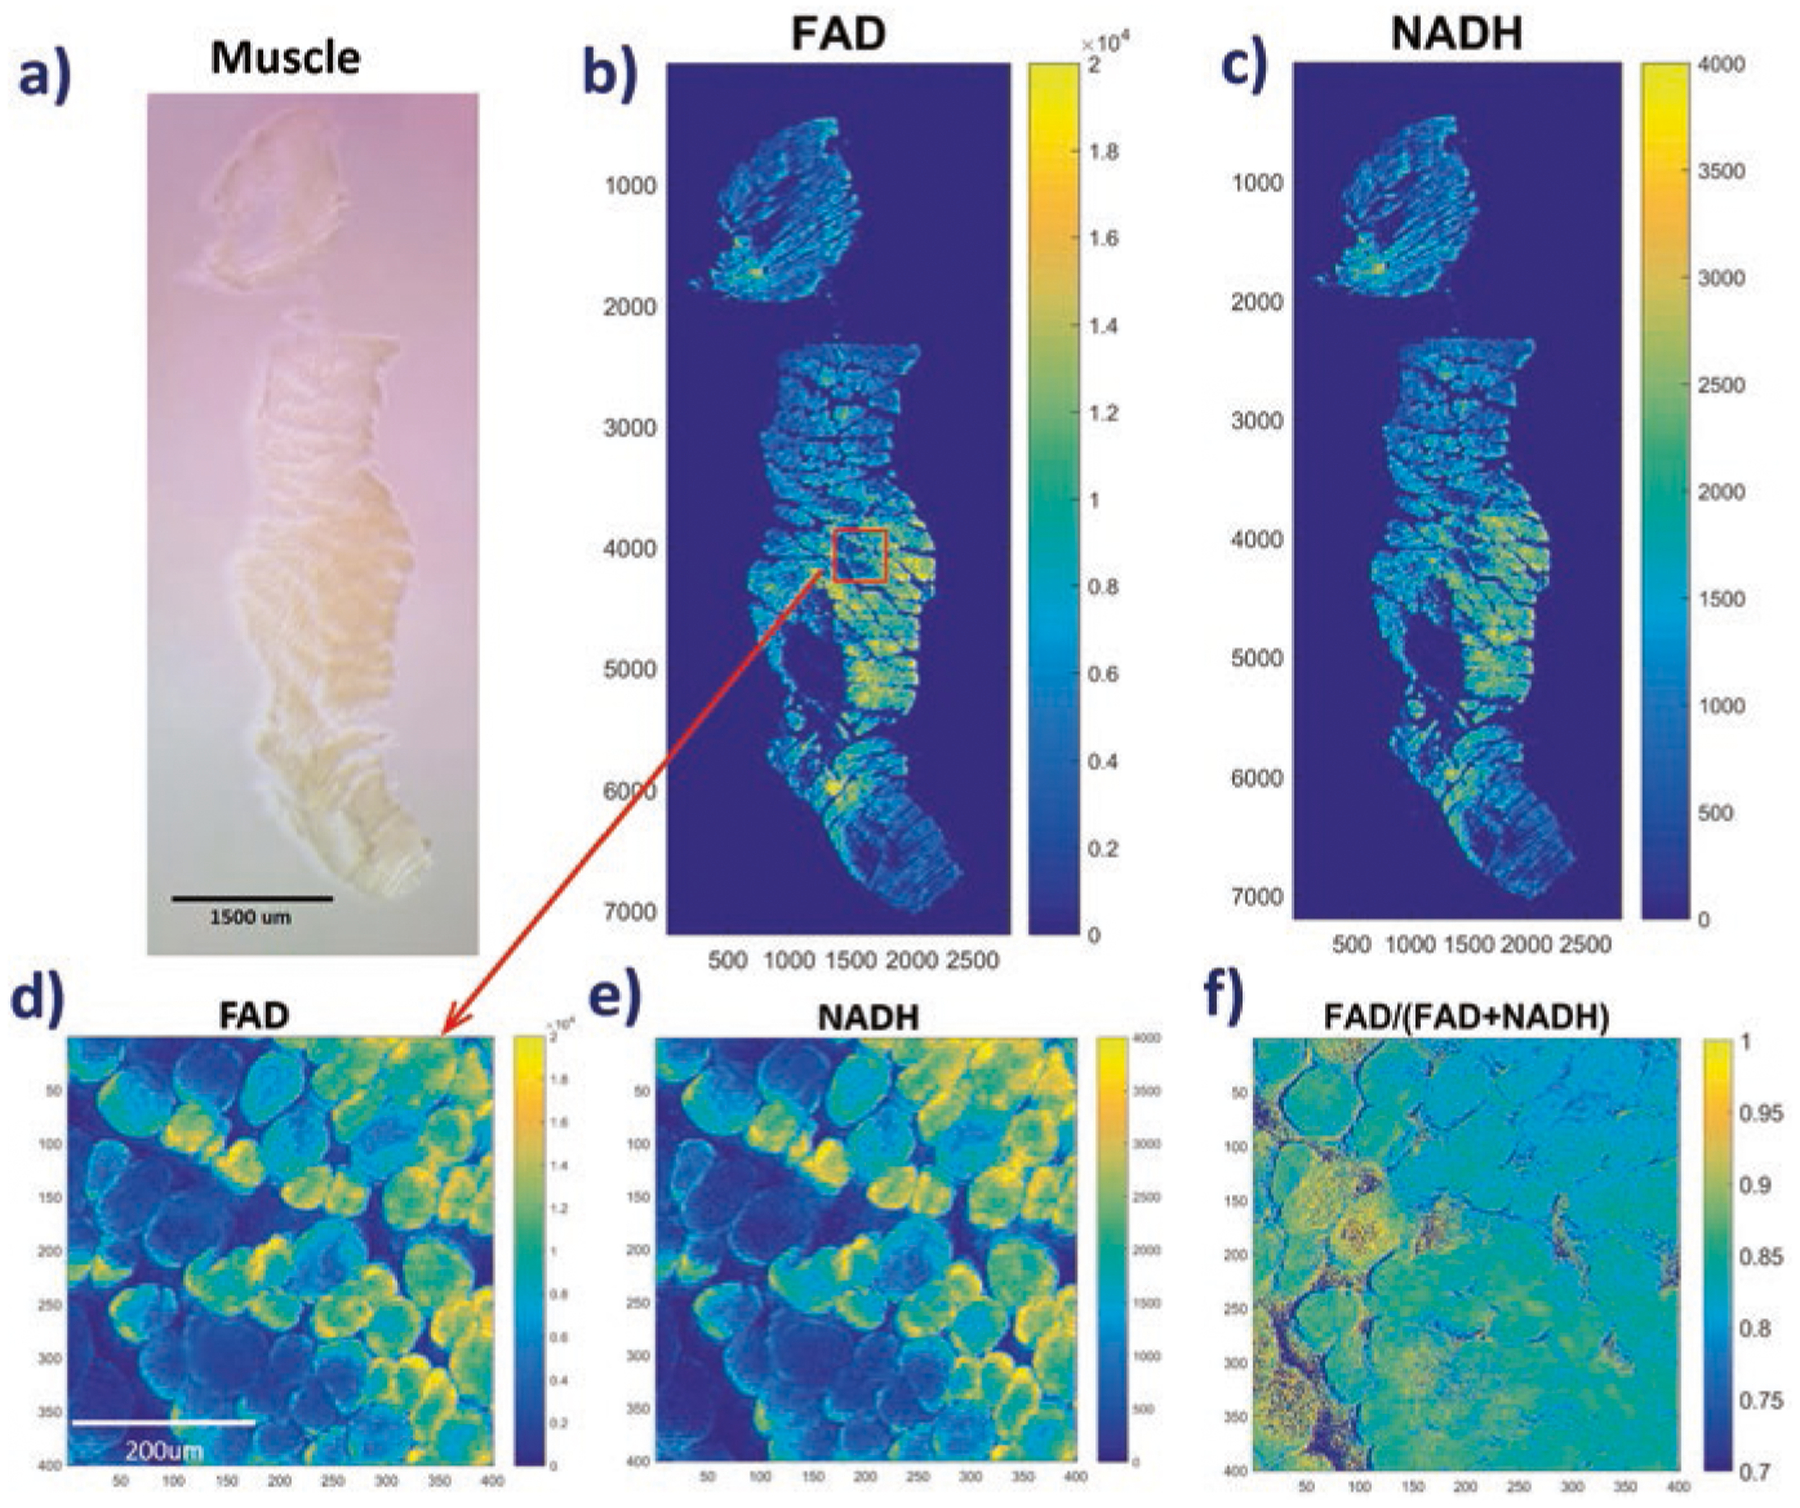
Fig. 1.

ORI of a typical fixed mouse muscle block. (a) White light photo of the sample; (b) FAD and (c) NADH images for the sample; (d–f) FAD, NADH and redox ratios images, respectively, for a FOV blown-up from (b). The numbers below and on the left sides of individual images represent x and y coordinates of the image matrices. The color bars on the right sides of images indicate the ranges of displayed parameters
