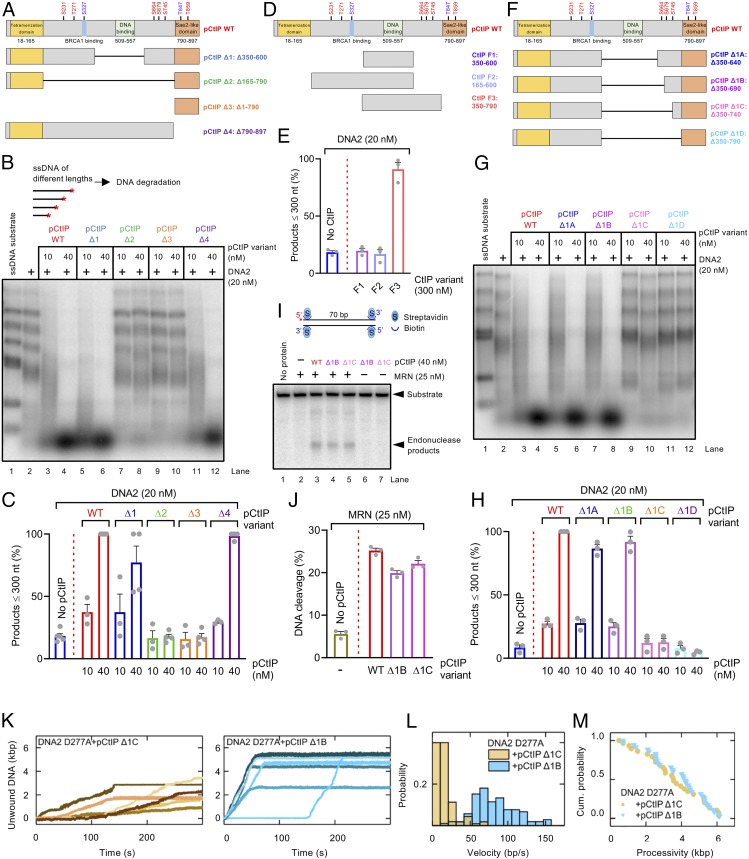
Fig. 5.
Separate domains of pCtIP promote the MRN and DNA2 nucleases. (A) A schematic representation of the primary structure of WT pCtIP and internal deletion variants (pCtIP Δ1 to Δ4) purified from Sf9 cells in the presence of phosphatase inhibitors. Main ATM phosphorylation sites are indicated in red, and CDK phosphorylation sites are indicated in blue. (B) Degradation ssDNA fragments of various lengths by DNA2 without or with pCtIP variants, as indicated. All reactions contained human RPA (864 nM). A red asterisk indicates the position of the radioactive label. (C) Quantitation of data such as shown in B. n = 3–4; error bars, SEM. (D) A schematic representation of purified recombinant CtIP fragments (F1 to F3) expressed in E. coli. Full-length pCtIP is again shown as a reference. (E) Quantitation of ssDNA fragment degradation into products smaller than ∼300 nt by DNA2 without or with F1 to F3 CtIP fragments. n = 3; error bars, SEM. (F) A schematic representation of internal deletion variants (pCtIP Δ1A to Δ1D) purified from Sf9 cells in the presence of phosphatase inhibitors. Full-length pCtIP is shown as a reference. (G) Degradation of ssDNA fragments of various lengths by DNA2 without or with various concentrations of WT pCtIP or Δ1A to Δ1D mutants, in the presence of human RPA (864 nM). (H) Quantitation of data such as shown in G. n = 3; error bars, SEM. (I) Endonuclease assay with MRN (25 nM) and WT full-length or pCtIP Δ1B and Δ1C variants. A red asterisk indicates the position of the radioactive label. (J) Quantitation of data such as shown in I. n = 3; error bars, SEM. (K) Representative DNA unwinding events using the DNA2 nuclease-dead mutant (D277A, 25 nM) in the presence of pCtIP Δ1C (25 nM) (yellow) and pCtIP Δ1B (25 nM) (cyan). Both reactions were also supplemented with 25 nM RPA. (L) Histograms of the observed unwinding velocities for nuclease-dead DNA2 (n > 25 traces for each case) in the presence of pCtIP Δ1C (yellow) and pCtIP Δ1B (cyan) with mean values of 16 ± 1 bp/s (SEM) and 85 ± 3 bp/s (SEM), respectively. (M) Cumulative probability distributions (shown as survival probability) of the processivity of the individual DNA unwinding events by nuclease-dead DNA2 D277A in the presence of pCtIP Δ1C (Left) and pCtIP Δ1B (Right) with mean values of 3.6 ± 0.3 kbp (SEM) and 3.8 ± 0.3 kbp (SEM), respectively.

