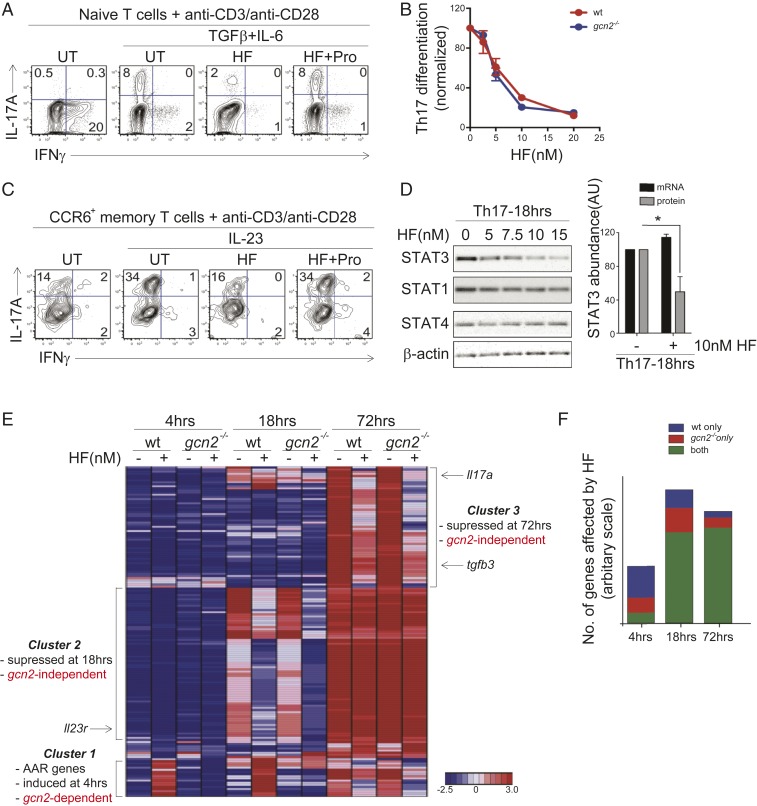
Fig. 4.
HF regulates TH17 differentiation and effector function in the absence of GCN2. (A) FACS analysis of IL-17A and IFN-γ expression in gcn2-deficient CD4+ T cells 4 d after activation in the absence (no cytokines) or presence of TH17-polarizing cytokines (TGF-β + IL-6). TH17-polarized cells were treated with vehicle (UT), 10 nM HF, or 10 nM HF plus 50 mM l-proline (HF+Pro), as indicated. Representative of three experiments. (B) Dose–response of HF on wild-type (red) or gcn2-deficient (blue) TH17 differentiation. Percentages of IL-17A+ cells (+SEM; n = 3) were determined by intracellular staining and FACS analysis as in A and are normalized UT cells. (C) FACS analysis of cytokine (IL-17A, IFN-γ) expression in gcn2-deficient CCR6+ memory TH17 cells 2 d after in vitro stimulation (anti-CD3/anti-CD28) in the presence or absence of IL-23. Cells were treated with vehicle (UT), 10 nM HF, or 10 nM HF plus 50 mM l-proline (HF+Pro), as indicated. Representative of three experiments. (D, Left) STAT protein levels, determined by Western blot, in gcn2-deficient CD4+ T cells stimulated in TH17-polarizing conditions as in A for 18 h. Cells were treated with titrating concentrations of HF. Representative of three experiments. (Right) Relative abundance (+SEM; n = 3) of STAT3 protein or Stat3 mRNA in gcn2-deficient CD4+ T cells stimulated in TH17-polarizing conditions for 18 h ± 10 nM HF. STAT3 protein levels determined by Western blot as above; Stat3 mRNA levels were determined by microarray. Abundance shown as fold-change in HF- vs. DMSO-treated samples, *P < 0.05; paired two-tailed Student's t test. (E) Hierarchical clustering of differentially-expressed genes (>2.5-fold change) in wild-type and gcn2-deficient CD4+ T cells cultured for the indicated times in TH17-polarizing conditions ±10 nM HF. Gene clusters (1–3) are indicated by text; examples of genes within clusters are indicated by text and arrows; figure based on mean gene expression values obtained from biological duplicates. (F) Proportion of genes affected by HF (10 nM) in wild-type CD4+ T cells, gcn2-deficient T cells, or both, determined by microarray as in E.

