Fig. 2.
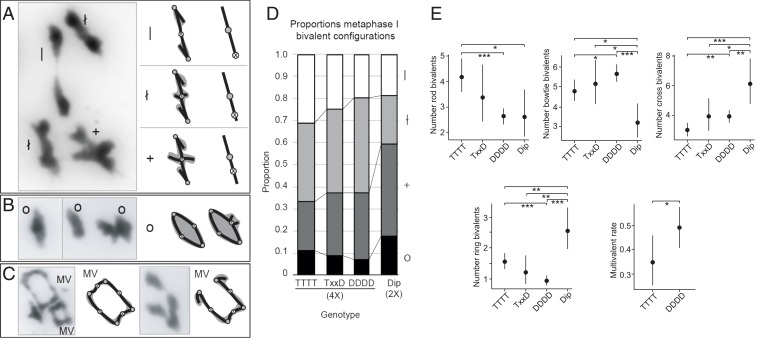
Metaphase I bivalent shapes. (A) Single crossover bivalents with little (|), intermediate (ł), or extensive (+) chromatin beyond a chiasma. (Left) Examples from metaphase spreads. (Right) Diagrammatic interpretations with stick interpretations and chromatin shaded in gray. CO position interpretation is shown in rightmost cartoons. Shaded circles indicate centromeres, and open circles with an “X” indicate positions of crossovers. (B) Examples of two-chiasma “ring” configurations (o) and diagrammatic interpretations. (C) Examples of ring quadrivalents (Left) and a chain quadrivalent (Right) with four and three chiasmata, respectively, along with diagrammatic interpretations. (D) Stacked bar graph showing metaphase I bivalent configurations (rod, |; bowtie, ł; cross, +; ring, O) as a proportion of scorable bivalents in diploid (Dip, 2×) and tetraploid (4×) A. arenosa with different genotypes at ASY1, where DDDD = homozygous for diploid allele, TxxD = heterozygous (TDDD, TTDD, or TTTD), and TTTT = homozygous for tetraploid allele. Values are calculated as means per genotype from bivalent proportions given in SI Appendix, Table S1. Shading indicates bivalent shapes as indicated to the right of the graph. Chiasma configuration interpretations are based on those in ref. 39. (E) Bivalent shape numbers and multivalent (MV)-containing cell proportions in diploids and ASY1-segregating tetraploid lines. Note that diploid counts have been doubled to enable direct comparison with tetraploid counts. Dots indicate trait means and error bars 95% confidence intervals calculated from GLMM models (SI Appendix, Table S3) from data in SI Appendix, Table S1. P values are indicated by bars above each graph: *P < 0.05, **P < 0.005, and ***P < 0.0005 (from SI Appendix, Table S3).

