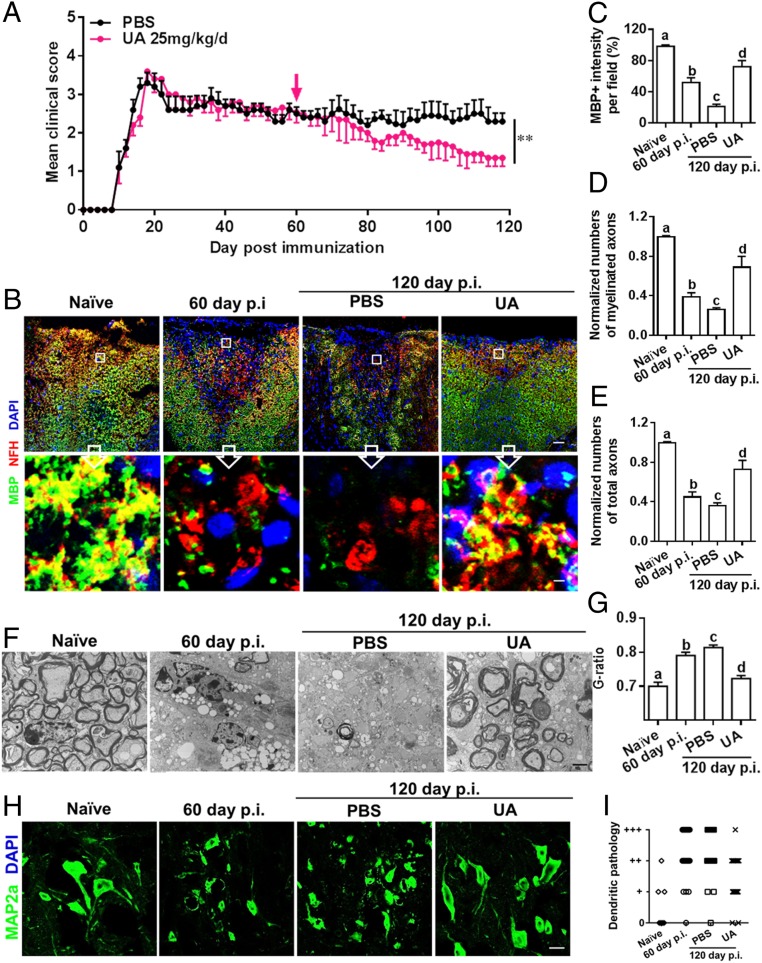
Fig. 2.
UA treatment alleviates chronic EAE, promotes remyelination, and reduces axon degeneration and neuron dendrite disruption. Female, 8- to 10-wk-old C57BL/6J mice were immunized with MOG35–55 and treated with PBS or UA (25 mg/kg/d) by oral gavage daily, starting on day 60 p.i. (late stage of chronic EAE). (A) Disease was scored daily on a 0 to 5 scale (mean ± SD; n = 6 to 10 each group). Lumbar spinal cords of naive and EAE mice were harvested before (day 60 p.i.) or after treatment (day 120 p.i.). (B) Double immunostaining of MBP (green) and NFH (red; for axons) showing significantly increased numbers of myelinated axons in the dorsal column of the spinal cord (MBP+NFH+). (Scale bar, 20 µm for the Upper row, and 1 µm for the Insets in the Lower row). (C) MBP intensity was measured in the white matter of spinal cord using Image-Pro. (D) Quantification of myelinated axons (MBP+NFH +) using Image-Pro. (E) Total axons (NFH +) were quantified using Image-Pro. (F) Electron micrographs for tissues of ventral lumbar spinal cords of PBS- and UA-treated EAE mice. (Scale bar, 2 µm.) (G) Quantification of the G-ratio (axon diameter/fiber diameter) of myelinated fibers in the ventral lumbar spinal cords of vehicle- and UA-treated EAE mice (PBS group, G-ratio = 0.8136 ± 0.006856; UA group, G-ratio = 0.7225 ± 0.008690). (H) MAP2a (green; dendrite marker) immunostaining at lumbar anterior horns of PBS- and UA-treated mice. (Scale bar, 10 µm.) (I) Scoring of MAP2a+ neuron dendritic disruption of different groups following a previously described protocol (16). A score of 0 (normal) was assigned when most or all neuron dendrites were of normal thickness and length. A score of “+” was assigned when the majority of neuron dendrites were thinner than normal, a score of “++” when the majority of neuron dendrites were shortened or fragmented, and a score of “+++” when the majority of neuron dendrites were lost. Groups designated by the same letter are not significantly different, while those with different letters (a, b, c, or d) are significantly different (P < 0.05 to 0.01), one-way ANOVA with Tukey’s multiple comparisons test. **P < 0.01, compared to PBS-treated group, one-way ANOVA with Tukey’s multiple comparisons test. All quantifications were made in three independent experiments. Symbols represent mean ± SD; n = 10 random areas per group.

