
Figure 2.
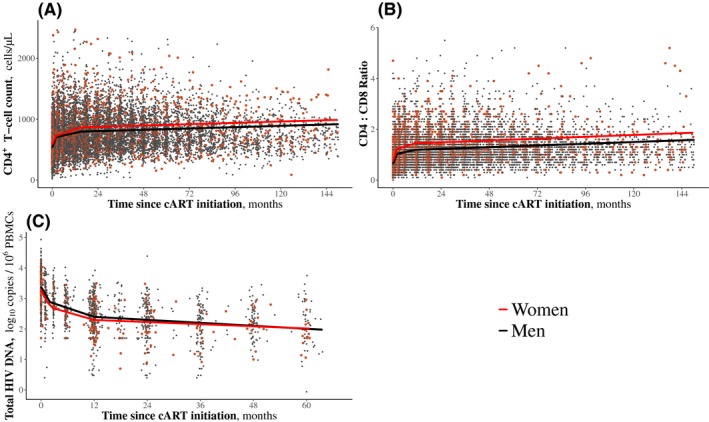
Immunovirological marker dynamics after ART initiation during acute and early HIV infection. Immunovirological marker dynamics were estimated using mixed models with random coefficients. (a) CD4+ T‐cell count: model run from 142 women and 1113 men. Points over 2000 cells/µL were cut from the graph for better visibility. (b) CD4:CD8 ratio: model run from 142 women and 1110 men. Points over 6 were cut from the graph for better visibility. (c) HIV DNA levels: model run from 70 women and 353 men. ART, antiretroviral therapy.