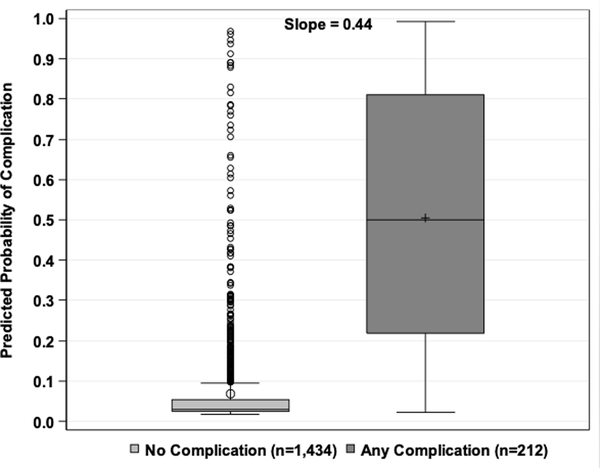
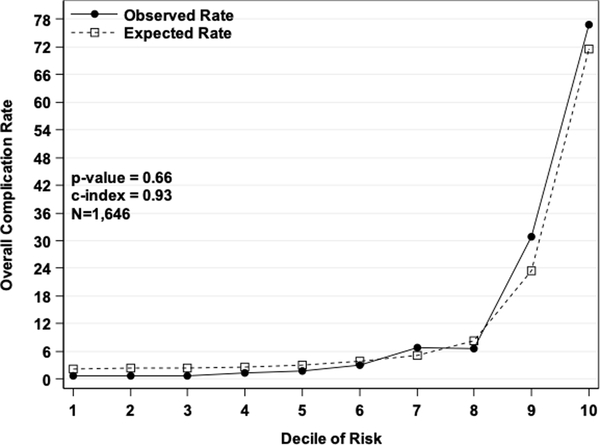
Figure 1.
a) Discrimination plot. Values on the x-axis are postoperative complication status from the NSQIP test set and values on the y-axis are predicted probabilities from the model fit to the test set. b) Hosmer-Lemeshow Calibration plot. Values on the x-axis are deciles of predicted risk of any complication and values on the y-axis are rates of complications for each decile. The two different lines are observed and expected rates.


