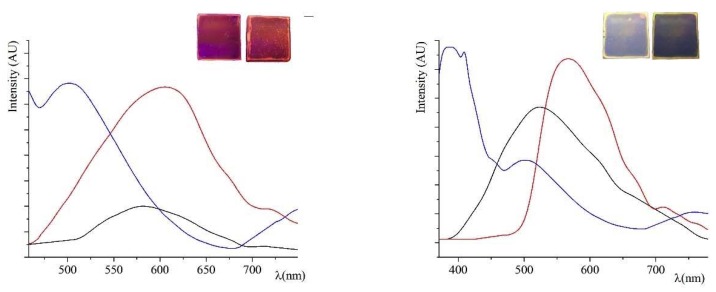
Figure 3.
Normalized emission curves recorded on polymers and 50% PVK blends. On the left: Thin film of P1 (red curve), M1-PVK (black curve) and PVK (blue curve) as reference. On the right: P2 (red curve), M2-PVK (black curve) and PVK (blue curve) as reference. The same spin-coated thin films photographed under the UV lamp at 365 nm in the inset (polymer on the left and blend on the right).

