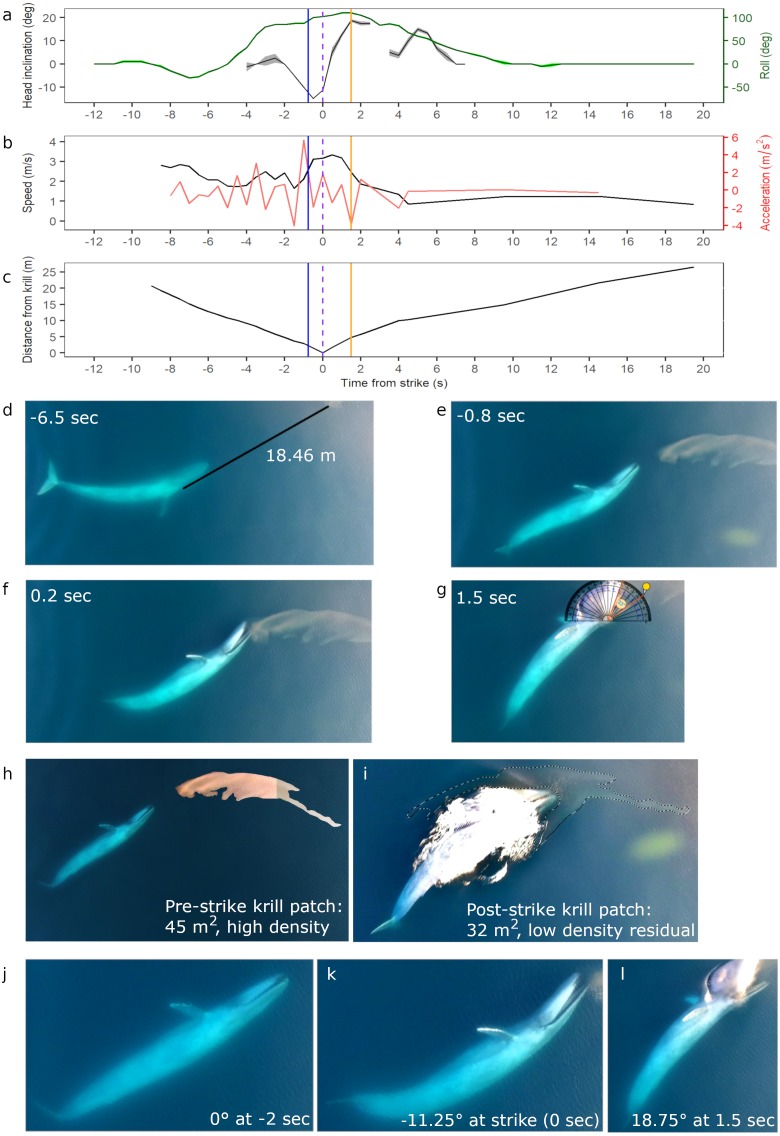
Figure 2. Body kinematics, and corresponding still images, during blue whale surface lunge feeding event derived from Unmanned Aerial Systems (UAS) image analysis.
(A) Mean head inclination and roll (with CV in shaded areas), (B) relative speed and acceleration, and (C) distance from the tip of the whale’s rostrum to the nearest edge of krill patch. Blue line on plots indicate when krill first respond to the predation event, and the purple dashed lines indicate strike at time = 0. The orange lines indicate the time at which the whale’s gape is widest, head inclination is maximum, and deceleration is greatest. (D) Image of whale eyeing krill patch with measured distance between eye and patch. (E) Image taken when krill begin to respond to predation event. (F) Image illustrating krill flee response. (G) Image of widest gape and angle measurement. Comparative images of krill patch size and density (H) pre- and (I) post-strike. Comparative images of head inclination (J) 2 s pre-strike, (K) at strike, and (L) post-strike of surface lunge feeding event (Example roll images in Fig. S2). Images in D–L are cropped to enhance illustrations (raw video available in the Supplemental Information). All images captured at 29.5 m altitude.

