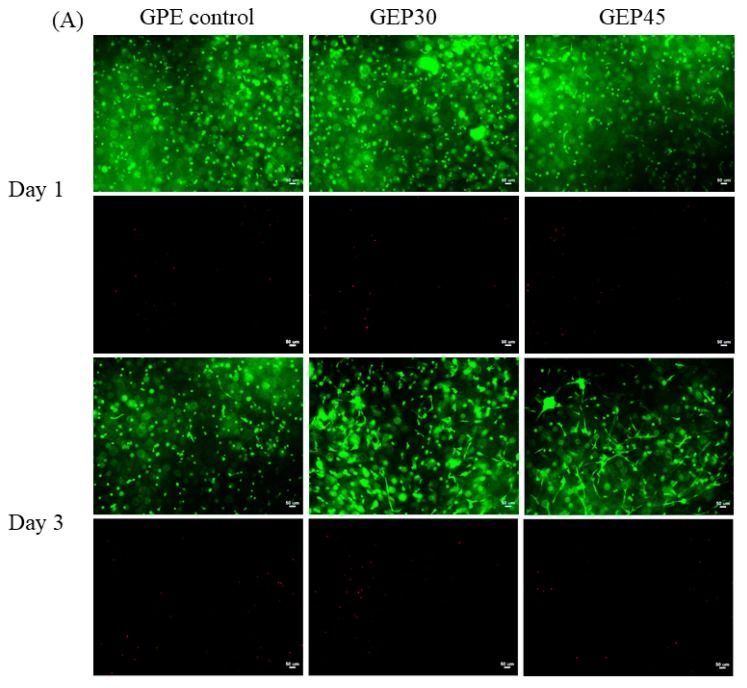
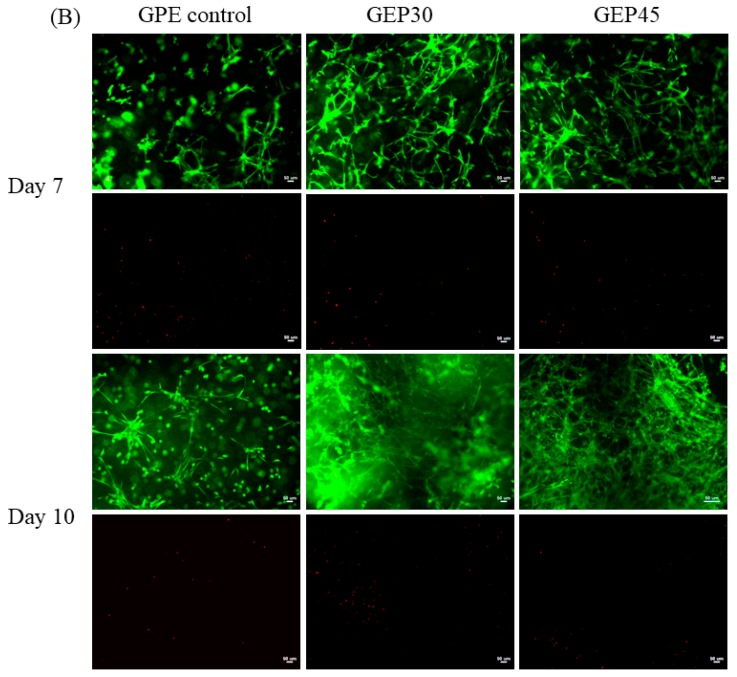
Figure 5.
(A,B). Cell morphology in gelatin and elastin hybrid PEG hydrogels at d1, 3 were presented in (A), while that of day 7 and 10 showed in (B), respectively. The first row of each time point is the live cell-staining (green color, Calcein AM), while the second row is the dead cell-staining (red, EthD-1). All the scale bars are 50 µm.


