
Figure 8. PD-1 ablation induces enhanced mitochondrial metabolism of myeloid cells in tumor-bearing mice and improved T cell function.
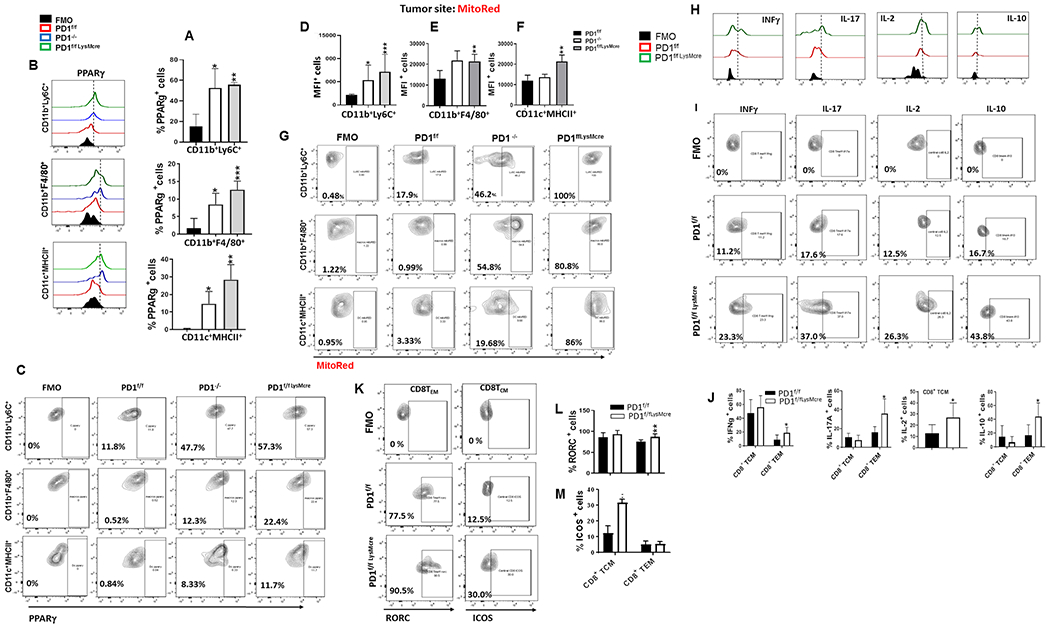
(A-C) Expression of PPARγ in myeloid cells at the B16-F10 site in PD-1f/f, PD-1f/fLysMcre and PD-1−/− mice was examined by flow cytometry. Mean percentages ± SEM (A), representative histograms (B) and contour plots (C) of PPARγ-expressing CD11b+Ly6C+, CD11b+F4/80+ and CD11c+MHCII+ subsets. (D-G) Mitochondrial metabolic activity of myeloid cells at the B16-F10 tumor site in PD-1f/f, PD-1f/fLysMcre and PD-1−/− mice was examined by assessing mitochondrial membrane potential using MitoRed. MFI ± SEM of MitoRed positive CD11b+Ly6C+, CD11b+F4/80+, and CD11c+MHCII+ subsets within the CD45+CD11b+ gate (D-F) and representative plots of FACS analysis (G) are shown. (H-L) In parallel, expression of IFN-γ, IL-17A, IL-2, IL-10, RORC and ICOS in CD8+ TCM and TEM isolated from B16-F10-bearing PD-1f/f and PD-1f/fLysMcre mice was assessed by flow cytometry. Representative histograms (H), contour plots (I, K), and mean percentages ± SEM (J, L, M) within the CD44hiCD62Lhi gate (for TCM) and CD44hiCD62lo gate (for TEM) cells are shown. Data are from one representative of four independent experiments. (* p< 0.05, ** p< 0.01, *** p< 0.001).