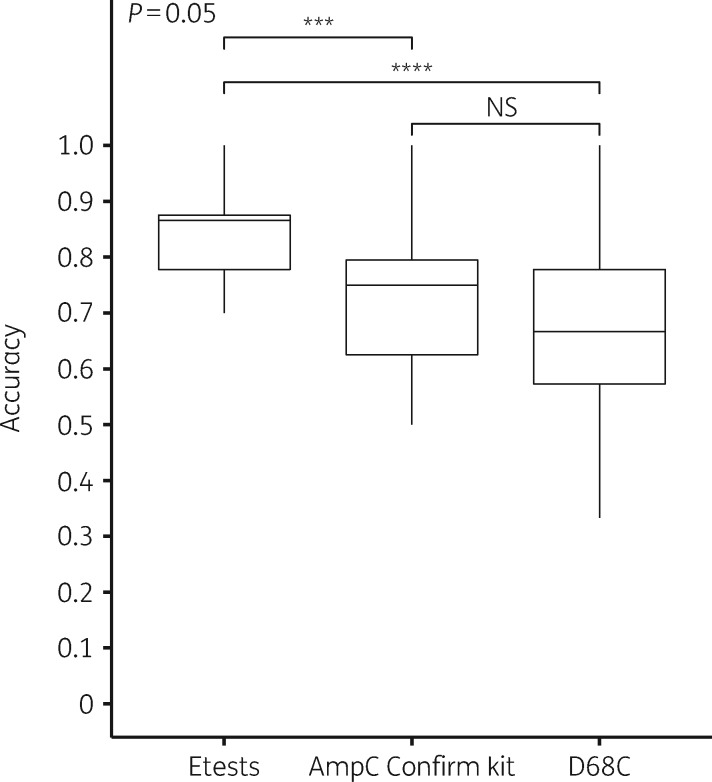
Figure 3.
Boxplots of model performance. The x-axis indicates the performance using Etests, AmpC Confirm Kit and MAST D68C. The y-axis indicates accuracy based on 10-fold three-times-repeated cross-validation using all 84 E. coli strains of the training set. ***P ≤ 0.001; ****P ≤ 0.0001; NS, not significant.

