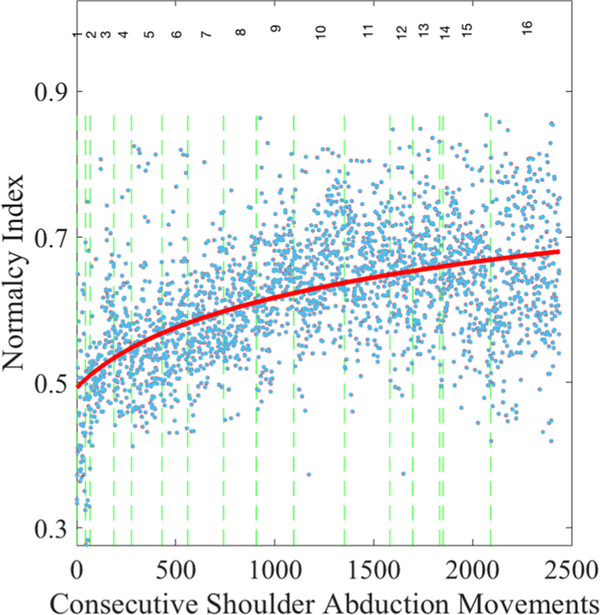
Fig. 7.
Plot of the kinematic normalcy index across about 2500 consecutive gestures enables calculation of dose-response curves for each movement for each individual. Blue dots represent the normalcy index for consecutive shoulder abduction (raise-arm) gestures. The vertical dashed lines demarcate each session of the game play. The solid red line is the negative exponential best fit across all gestures

