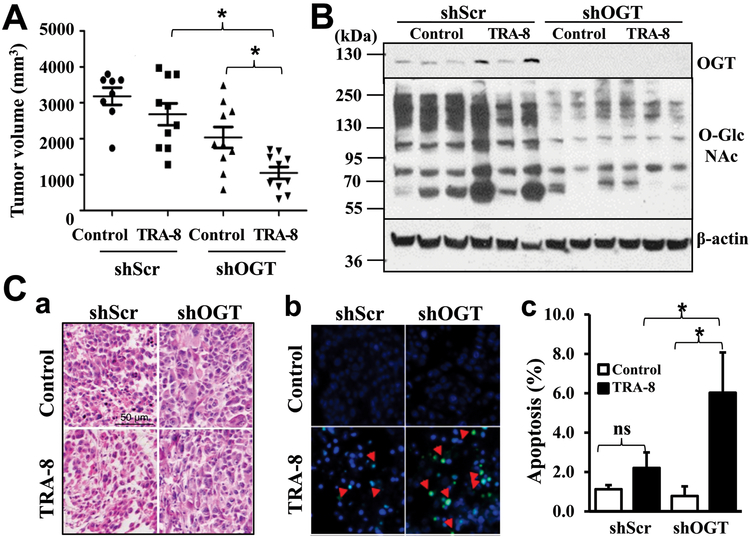
Figure 4. OGT knockdown increases sensitivity of resistant pancreatic cancer to TRA-8 therapy in mice.
S2VP10 cells stably infected with scrambled shRNA (shScr) or shRNA for OGT (shOGT) were injected into nude mice, which were then subjected to control vehicle (Control) or TRA-8 treatment for 3 weeks. A) Tumor volumes, in each group are shown (n=8-10/each group, *p<0.05); B) Protein O-GlcNAcylation and OGT expression, in representative tumors in each group was determined by Western blot analysis. The expression of β-actin was used as a loading control. C) Cell death in tumors was analyzed by TUNEL staining. a. Representative H&E staining images from each group (Scale bar=50μm). b. Representative TUNEL staining images (red arrows indicating positive staining). b. Quantitative analysis of TUNEL positive cells as percentage of total cells in the tumor sections (ns=not significant, *p<0.05).

