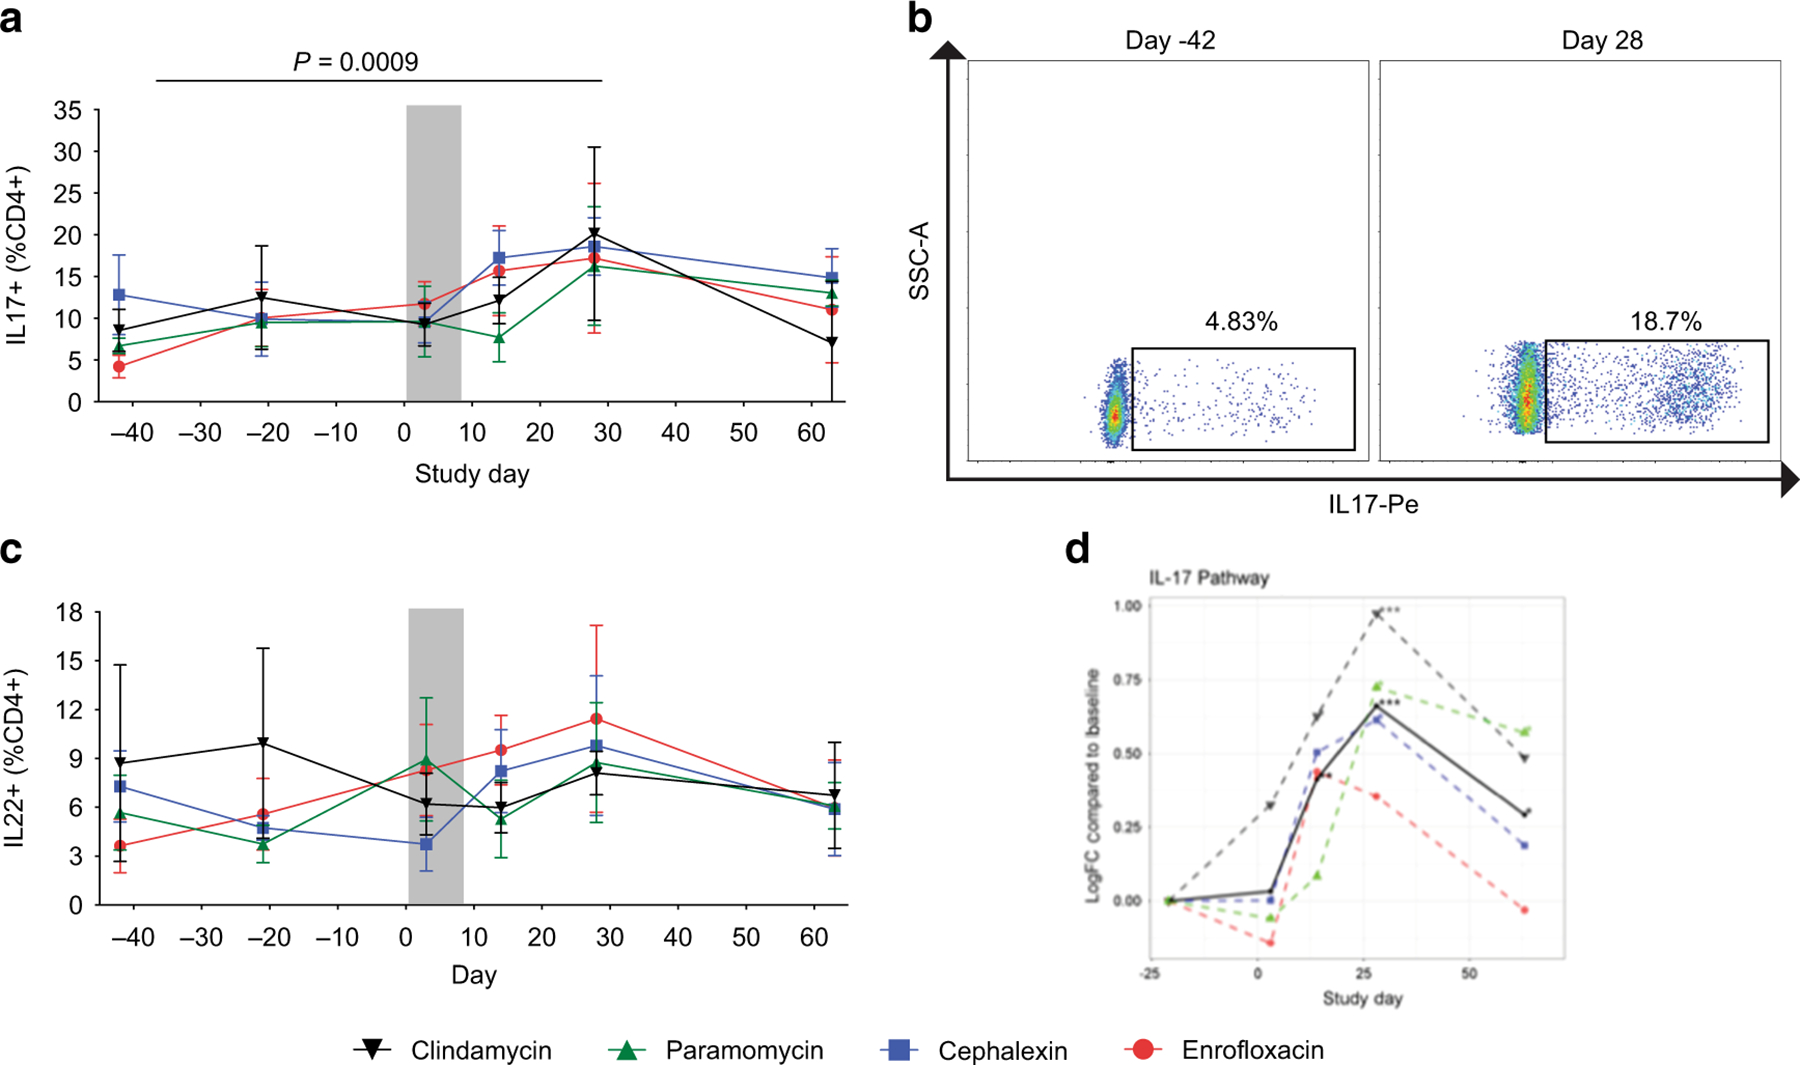
Figure 6. IL-17 producing CD4+ T cells increase in the colonic mucosa following the antibiotic treatment.

(A) Flow cytometry analysis demonstrated an increase of IL-17 producing CD4+ T cells (defined as CD45+CD3+CD4+IL17+) in the colonic mucosa after the antibiotic treatment (indicated by the gray bar) at Day 14 and a significant increase at Day 28, which returned to pre-antibiotic values by Day 63. (B) Representative flow cytometry plots demonstrating increased frequency of IL-17-producing CD4+ T cells on Day 28. (C) We observed an increase in the frequency of IL-22-producing CD4+ T cells. (D) mRNA-seq analysis similarly demonstrated increased expression of genes in the IL-17 pathway on Day 14–28 after the antibiotic treatment. Enrofloxacin – red circles, cephalexin – blue squares, paromomycin – green triangles, clindamycin – black upside-down triangles. P values were determined using a paired-t test with Bonferroni Correction for for multiple comparisons. Statistics were performed across all antibiotic treatment groups.
