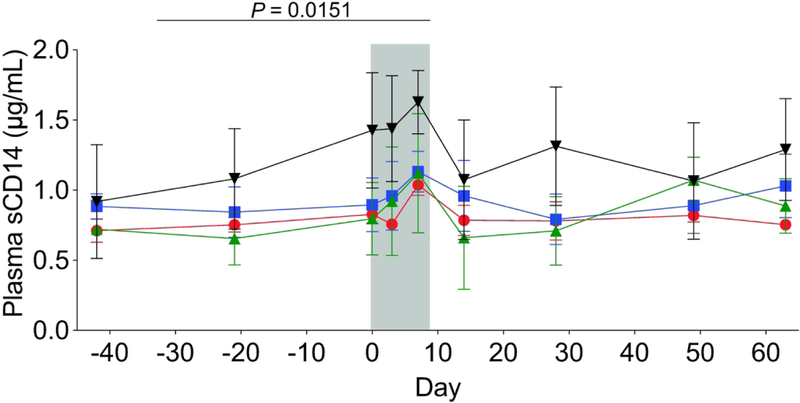
Figure 7. Plasma concentrations of sCD14 increased during antibiotic treatment.
Across all treatment groups, we observed an increase in plasma concentrations of sCD14 during the antibiotic treatment (indicated by the gray bar), which reached significance at Day 7. Plasma sCD14 levels returned to pre-antibiotic values following cessation of antibiotics. These data support an inflammatory response during the antibiotic treatment. Enrofloxacin – red circles, cephalexin – blue squares, paromomycin – green triangles, clindamycin – black upside-down triangles. P values were determined using a paired-t test with Bonferroni Correction for for multiple comparisons. Statistics were performed across all antibiotic treatment groups.

