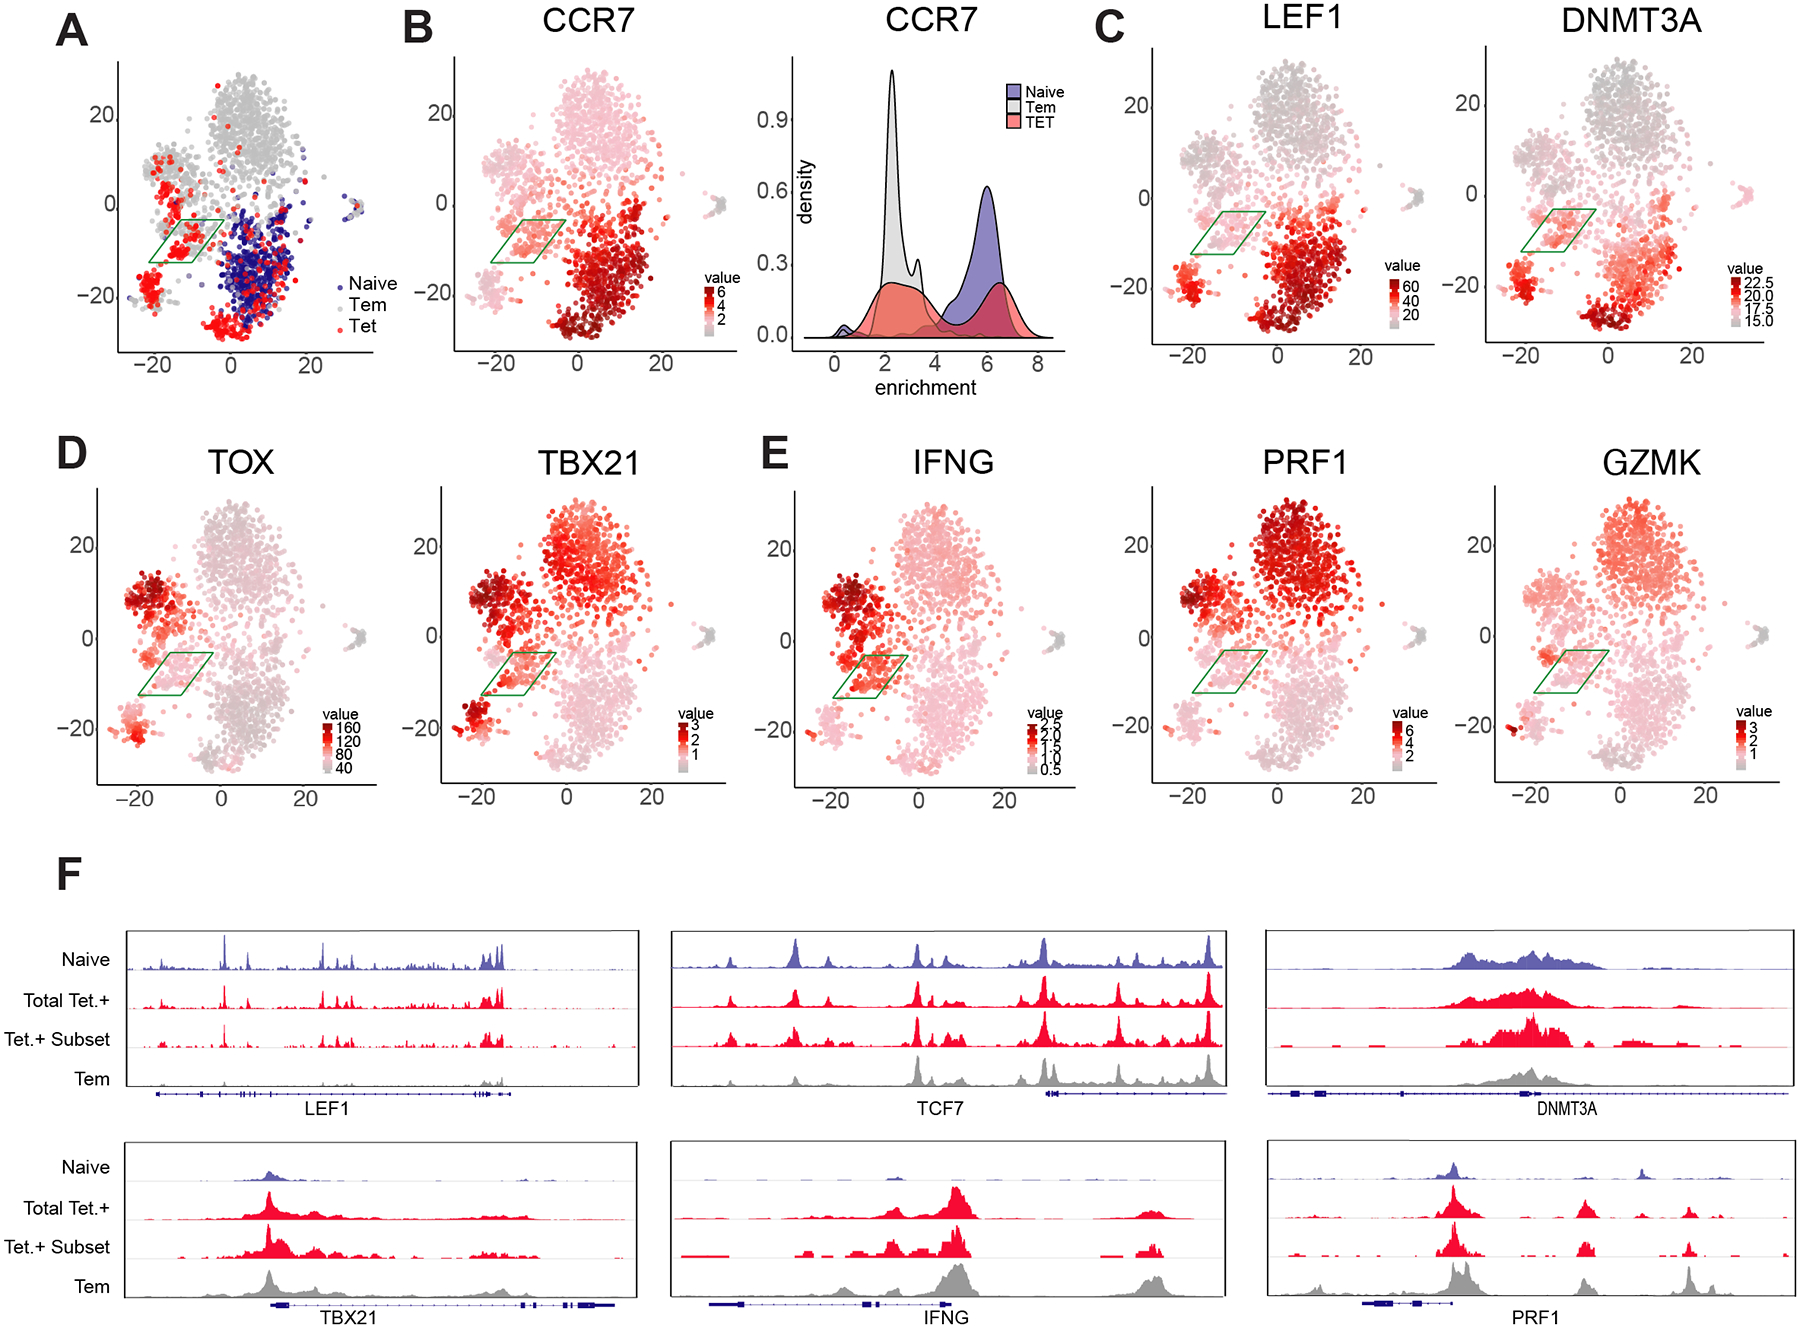
Figure 4: Single cell ATACseq profiling identifies naive and effector epigenetic programming within individual beta cell-specific CD8+ T cells.

(A) t-SNE analysis of individual cell chromatin accessibility profiles for all (aggregated) Tetramer+ CD8+ T cells and representative naive and Tem populations from three donors. For all cells, heatmap for the chromatin accessibility profile of CCR7 (B), LEF1 and DNMT3a (C) TOX and TBX21 (D), IFNG, PRF1, and GZMK (E). (F) Composite (N = 3) ATACseq profiles showing accessibility peaks across the loci of LEF1, TCF7, DNMT3a, TBX21, IFNg, and PRF1 loci for naive, Tem, and beta cell-specific CD8+ T cells (Tetramer +).
