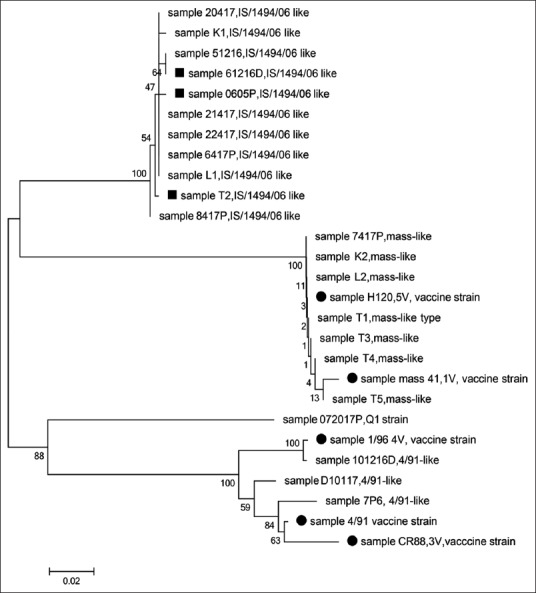
Figure-3.

Phylogenetic tree analysis of the partial spike 1 gene sequences of IBV vaccine strains and field isolates. The solid circle is the IBV vaccine strains. The solid squares are the mismatched IBV (in HRM analysis, those isolates were clustered in cluster 2 (Mass-like type), but in sequencing, they were of IS/1494/06 like). The evolutionary history was inferred using the neighbor-joining method. The percentage of replicate trees in which the associated taxa clustered together in the bootstrap test (1000 replicates) is shown next to the branches. There were a total of 315 positions in the final dataset. Evolutionary analyses were conducted in MEGA6.
