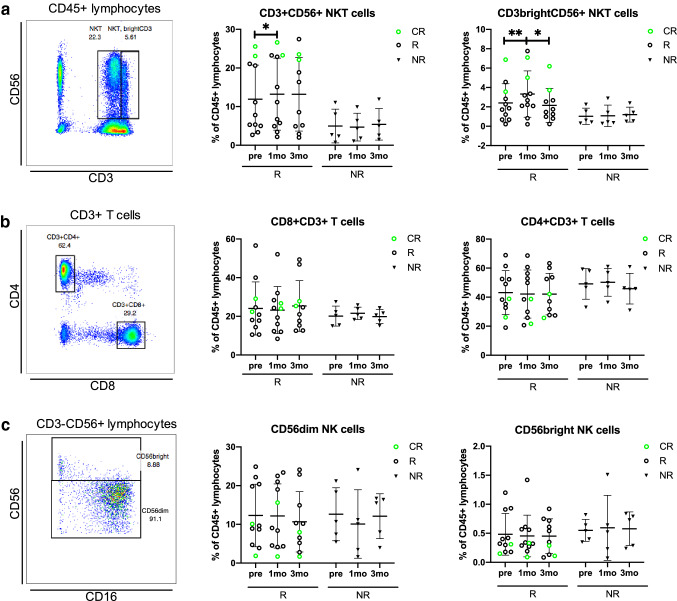
Fig. 2.
The proportion of NKT cells increases in responders after 1 month of anti-PD1 treatment. Gating strategies of a CD3+CD56+ and CD3brightCD56+ NKT cells from lymphocytes, b CD3+CD4+ and CD3+CD8+ T cells from total T cells, c CD56dim and CD56bright NK cells from the total lymphocyte population before treatment (pre), at 1 month (1mo) and at 3 months (3mo) of anti-PD1 therapy. Green circles represent the complete responders (CR), black circles represent responders (R) and black triangles represent non-responders (NR). The statistical difference between time points within same cohort was calculated with Students t test

