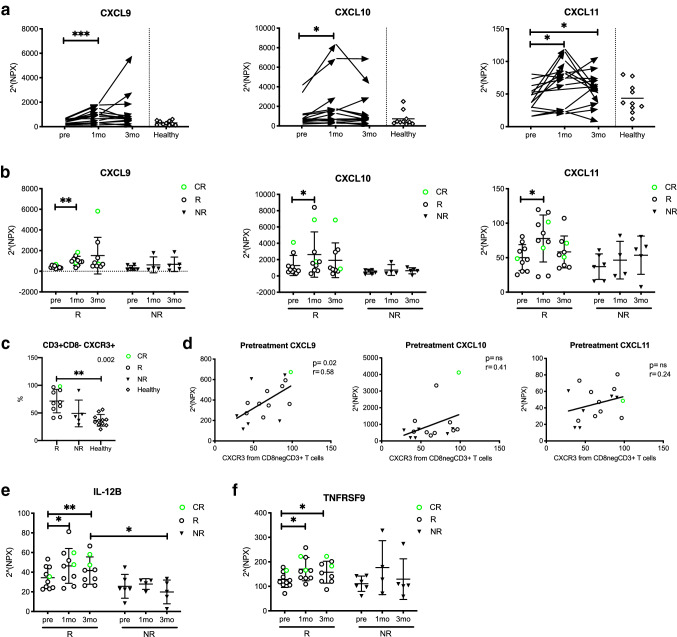
Fig. 4.
Cytokines related to antitumor immune response increase in responders’ peripheral blood during anti-PD1 treatment. Cytokine levels of CXCL9, CXCL10 and CXCL11 in a all patients at different time points and b in responders (R) vs. non-responders (NR) measured with the Olink immunoassay. c Proportion of CXCR3+ CD3+CD8− T cells at pretreatment defined by flow cytometry in R, NR and healthy subjects. d Correlation of CXCR3+ CD3+CD8− T cells and serum CXCL9, CXCL10 and CXCL11. e Cytokine levels of IL-12B and f TNFRSF9 in R and NR. Protein levels are presented as Normalized Protein eXpression (NPX) values, an arbitrary unit on the log2-scale. Green circles represent the complete responders (CR), black circles represent responders (R) and black triangles represent non-responders (NR), diamonds represent healthy controls (healthy). Statistical differences between time points within the same cohort were calculated with the Student’s t test (a, b, e, f), and the range of the p values are labeled with asterisks. Statistical differences in c were calculated with Kruskal–Wallis test (p values) and Dunn’s multiple comparisons test (asterisks). Statistical differences between the two cohorts, R vs NR, in e were calculated using the Mann–Whitney U test. Correlation analysis was done using Spearman’s correlation

