Figure 2.

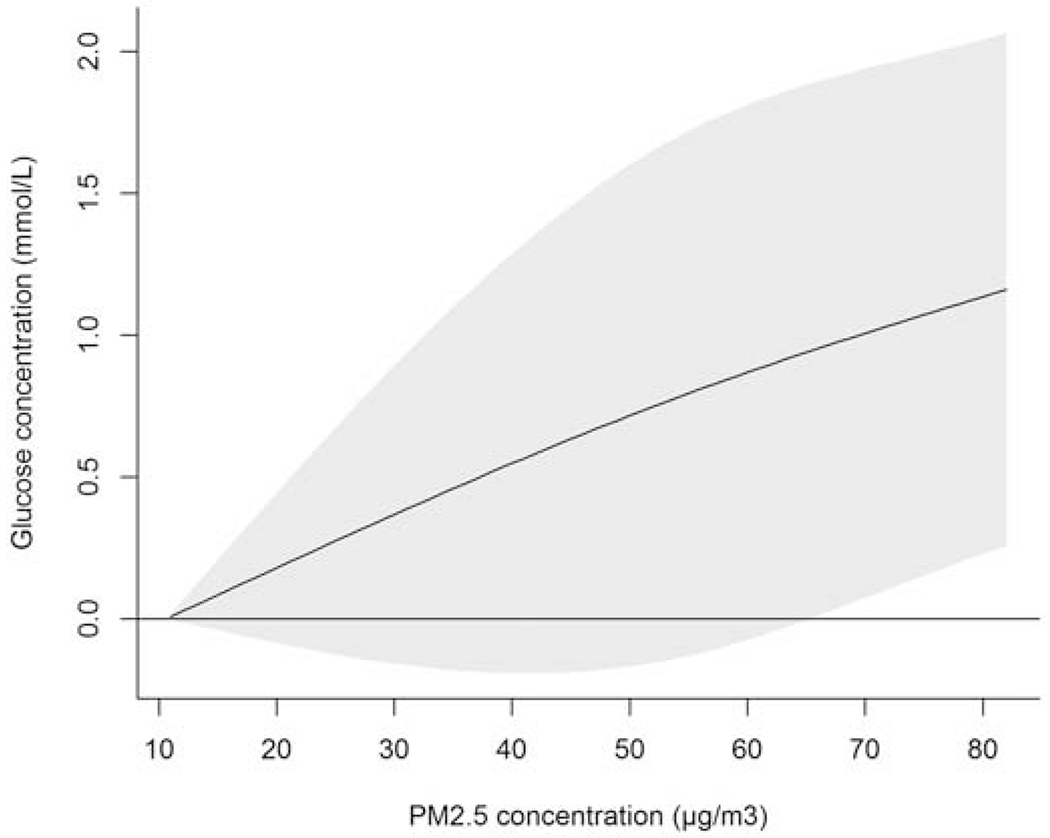
Increase of glucose concentration (mmol/L) associated with increase of previous 3 years average PM2.5 exposure (compared with the minimum concentration of PM2.5 exposure)

Increase of glucose concentration (mmol/L) associated with increase of previous 3 years average PM2.5 exposure (compared with the minimum concentration of PM2.5 exposure)