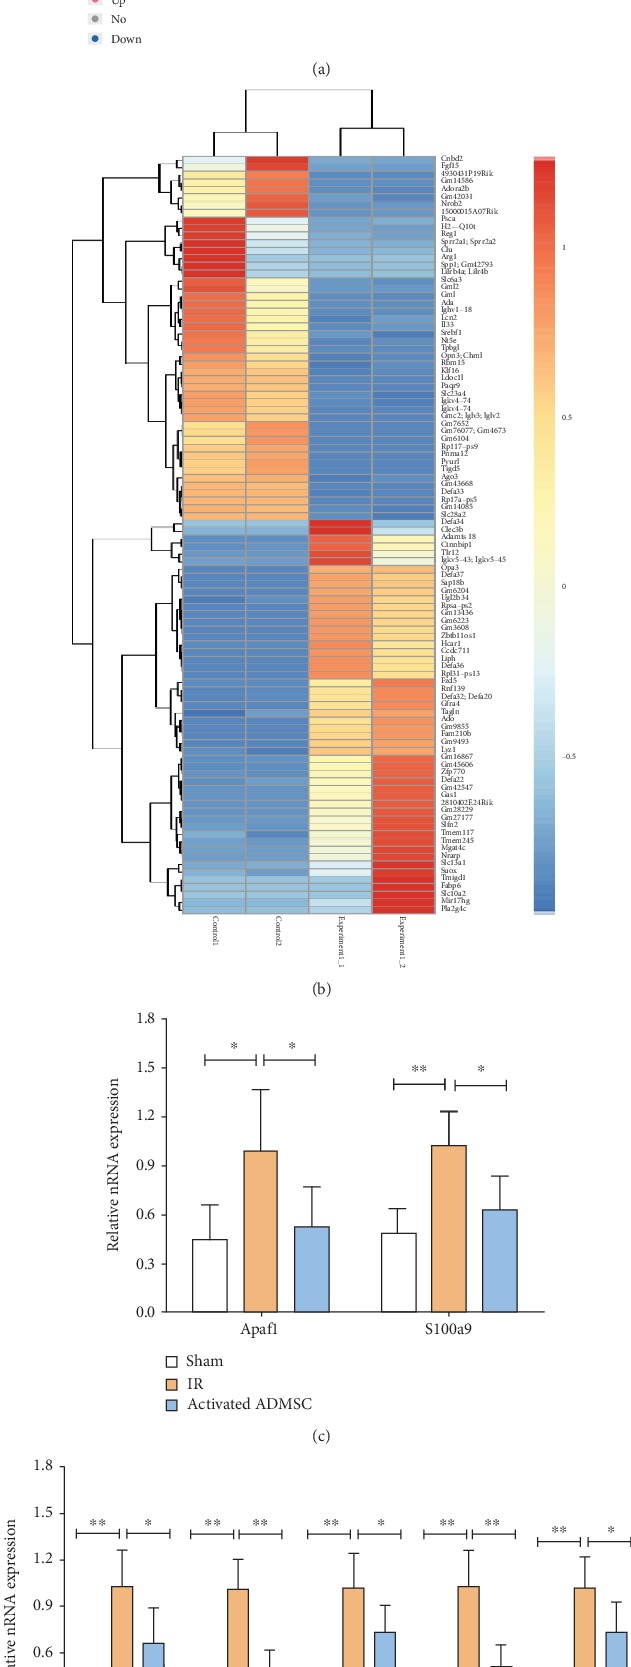
Figure 6.

mRNA sequencing revealed that activated ADMSC treatment induced alteration of mRNA expression in comparison with the IR group. (a) Volcano plot showed differentially expressed mRNAs between the activated ADMSC and IR groups. (b) Hierarchical clustering showed the top 100 deregulated mRNAs between the activated ADMSC and IR groups. (c, d) Results of real-time RT-PCR confirmed that seven mRNAs were upregulated in the IR group and down-regulated in activated ADMSC group, which was in lined with results from mRNA sequencing (∗P < 0.05, ∗∗P < 0.01, Bonferroni's multiple comparison).
