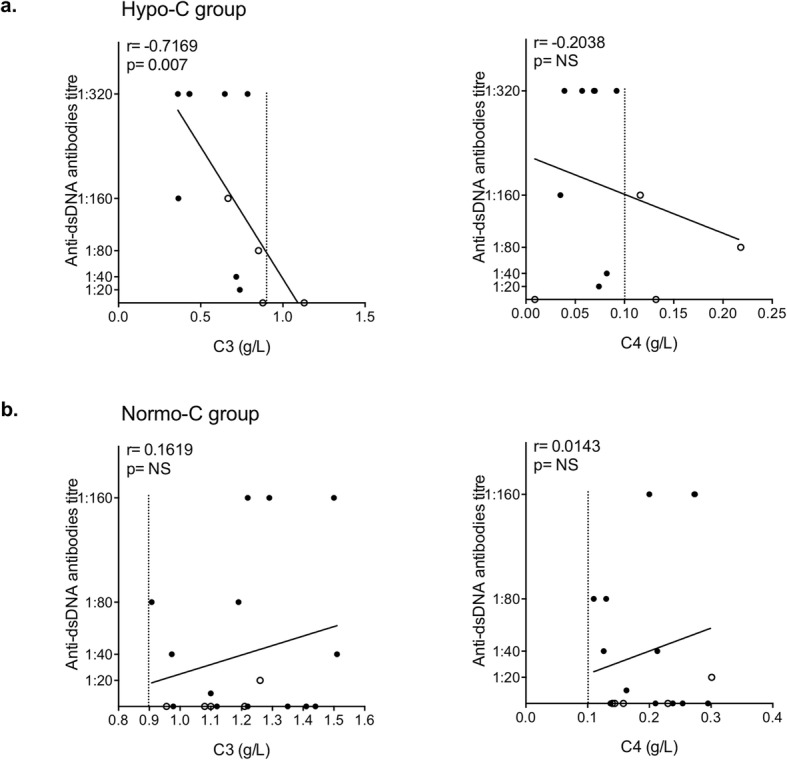
Fig. 5.

Linear regression analysis between C3 and C4 levels with anti-dsDNA antibodies in the Hypo-C (a) and Normo-C (b) group, by calculating Spearman’s rank correlation coefficient. p values < 0.05 were considered significant (NS, not significant). The dashed line shows the lower threshold value for C3 (0.9 g/L) and C4 (0.1 g/L). In a, the black dots represent patient with a low level of both C3 and C4, whilst the white dots symbolize subjects with low levels of either C3 or C4; in b, normocomplementemic patients which previously showed low complement levels are indicated by white dots
