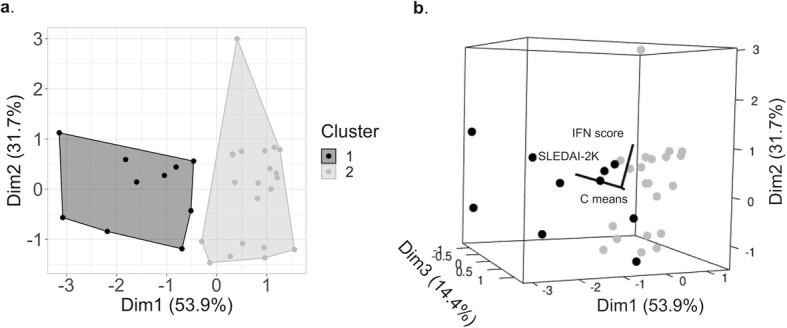
Fig. 6.

Cluster analysis results (K-means clustering) considering IFN score, SLEDAI-2K and mean complement levels (C means, mean value of C3 and C4 levels normalized on the respective lower threshold) that divide patients into subgroups by similarities. a 2D clusters representation (each dot represents a subject; Dim1 and Dim2 show the higher differences between the main clusters; Cluster 1: Hypo-C group, Cluster 2: Normo-C group). b 3D cluster representation (each sphere represents a patient; Dim3 reports minor difference in the third dimension, accentuated by SLEDAI-2K)
