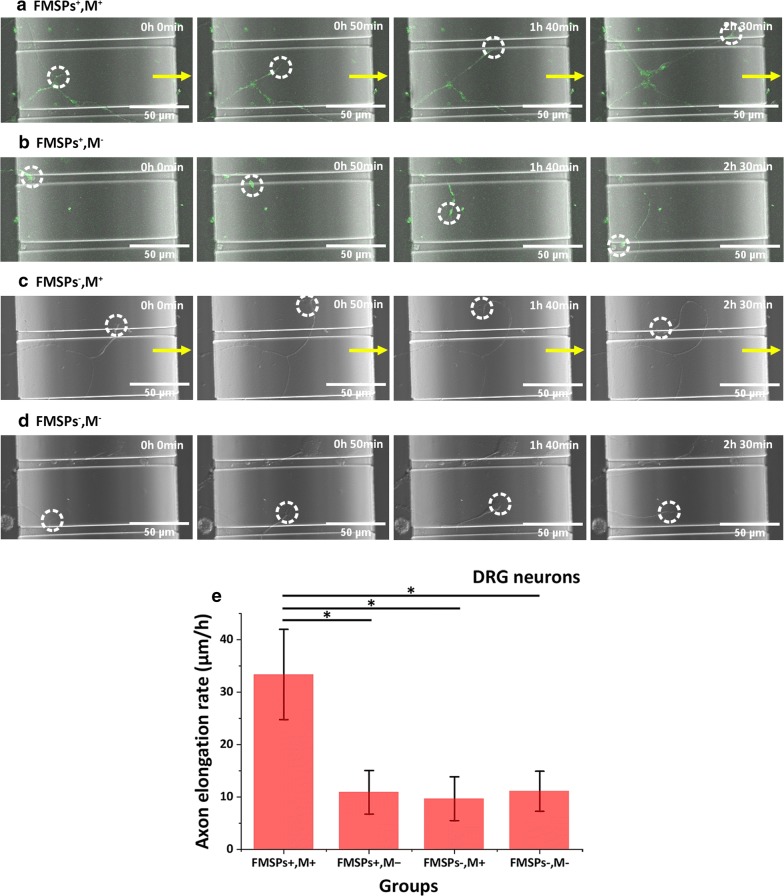
Fig. 7.
Time-lapse imaging of growth cone motility and axon elongation of DRG neurons in the a treatment group (FMSPs+, M+), b FMSP control group (FMSPs+, M−), c magnetic field control group (FMSPs−, M+) and d blank control group (FMSPs−, M−). e The average elongation rate of the axons in the treatment group compared to the control groups. A total of 173, 145, 154 and 138 axons were collected and measured in the four experimental groups, namely, the treatment group, FMSP control group, magnetic field control group and blank control group, respectively. The yellow arrows represent the direction of the magnetic field. The white circles highlight the growth cones. The images in a–d were captured at intervals of 50 min. *P < 0.05

