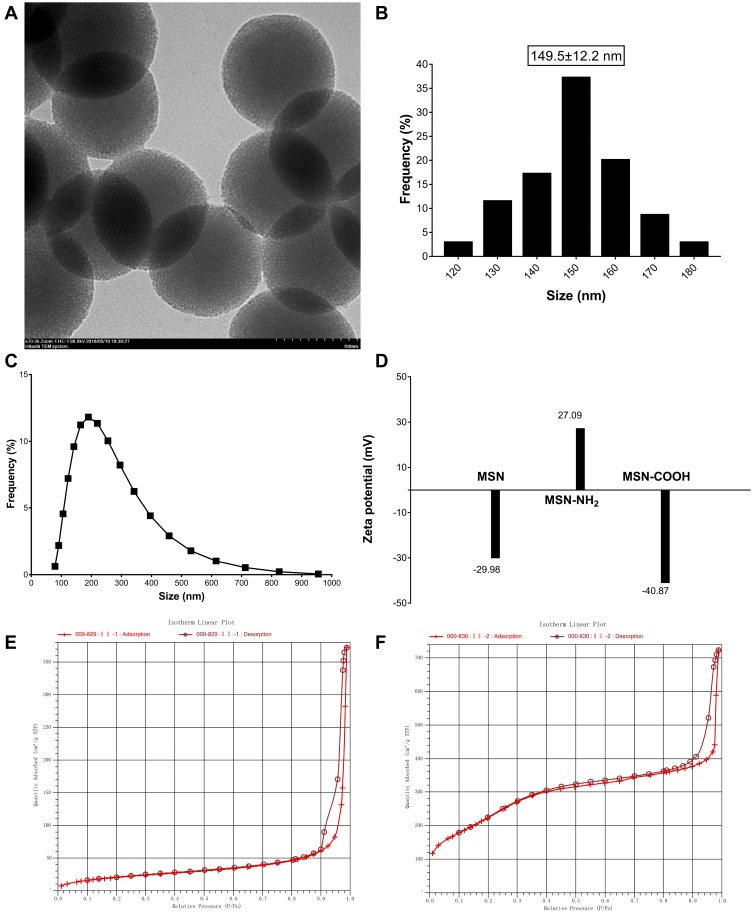
Figure 1.
TEM image (A) and particle sizes (B) of mesoporous silica nanoparticles (×70.0k). The size distribution curve (C) of MSN and Zeta potential (D) of MSN, MSN-NH2 and MSN-COOH. N2 adsorption−desorption isothermals of MSN-CTAB (E) and MSN (F).
Notes: The X axis labeling of (E) and (F) is “Quantity Absorbed (cm3/g STP)”; the Y axis labeling of (E) and (F) is “relative pressure (P/Po)”.
Abbreviations: TEM, transmission electron microscopy; MSN, mesoporous silica nanoparticle; CTAB, cetyltrimethylammonium bromide.

