FIGURE 3:
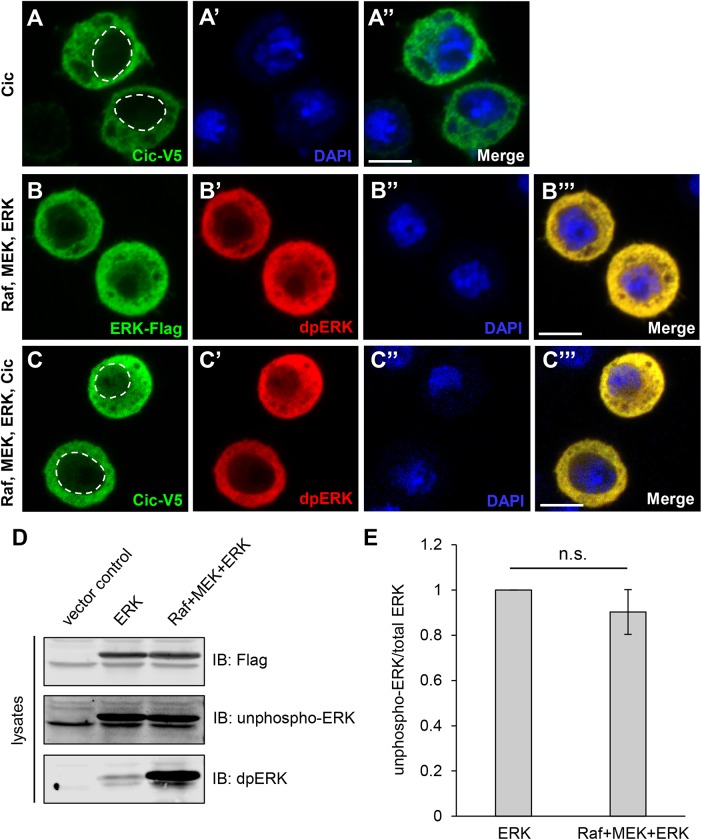
Localization studies of Cic, ERK, and dpERK in S2 cells, and ERK phosphorylation analysis. In A–C‴, transfected expression constructs are shown on the left, and staining signals are shown on the individual panels. In A and C, dashed lines indicate nuclear boundaries. Scale bars, 5 µm. (A–A″) Cic-V5 was predominantly cytoplasmic, with some nuclear distribution. (B–B‴) When cotransfected with MEK and Raf, both ERK-Flag and dpERK signals were mostly cytoplasmic but also showed nuclear localization. (C–C‴) When Cic-V5 and ERK-Flag were cotransfected with Raf and MEK, the Cic-V5 and dpERK signals remained predominantly cytoplasmic, with some nuclear distribution. (D) Extracts from S2 cells transfected with vector control, ERK alone, or ERK together with MEK and RAF were analyzed by Western blotting. A representative blot of three independent experiments is shown. (E) Quantification of results in D. No significant down-regulation of unphospho-ERK signal was observed with cotransfection of Raf and MEK, despite a detectable up-regulation of dpERK. n = 3; n.s., not significant (p > 0.05).

