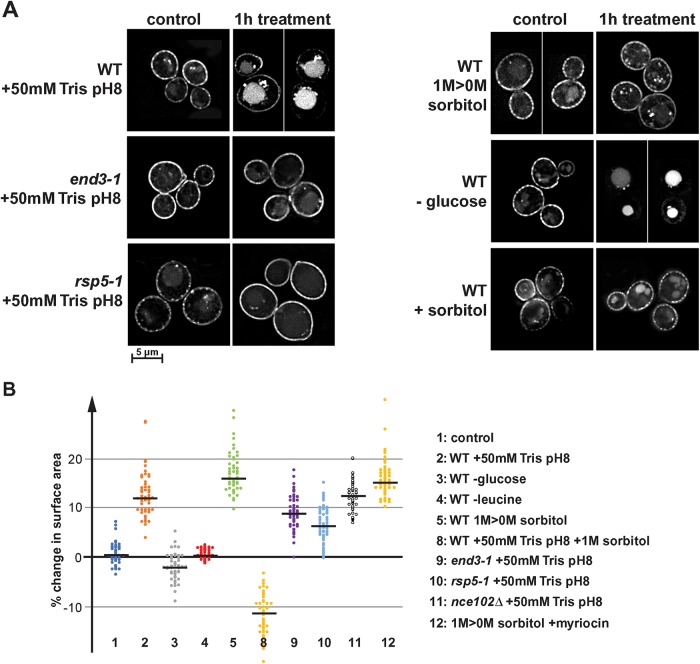
FIGURE 4:
Effect of different stresses on Fur4 localization and on cell surface area. (A) Fluoresence microscopy of wild-type, end3-1, and rsp5-1 cells expressing Fur4-GFP (SEY6210 pJK19, BWY1346 pJK19, MYY880 pJK19). The pictures show a single optical section through the center of the cells. Cells were grown in SDcomp-ura or in the case of the hypoosmotic shock (-sorbitol) in SDcomp-ura +1 M sorbitol. These cells were shifted into medium either containing 50 mM Tris, pH 8, containing 1 M sorbitol (+sorbitol), lacking glucose (-glucose), or lacking sorbitol (-sorbitol). (B) Quantification of the cell surface area change of 50 cells after treatment in the microfluidics system (15 min treatment if not indicated otherwise). The black line indicates the median of each data set.

