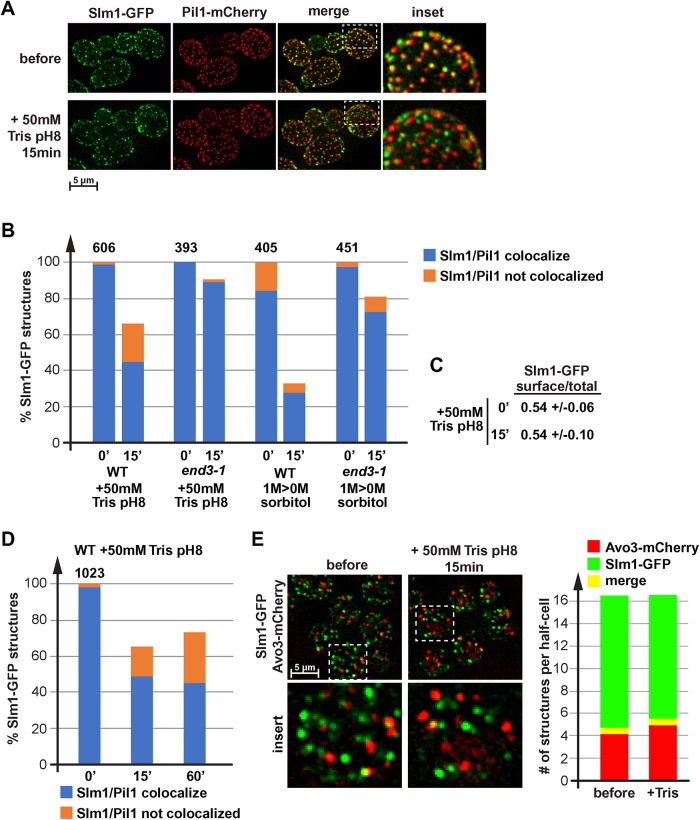
FIGURE 6:
Loss of proton gradient causes relocalization of Slm1. (A) Wild type expressing Slm1-GFP and Pil1-mCherry (LGY31) was analyzed by fluorescence microscopy using a microfluidics device. The pictures show projections of 10 optical sections representing the bottom half of the cells. The cells were grown in SDcomp and shifted to conditioned SDcomp +50 mM Tris, pH 8. (B, D) Quantification of Slm1 localization relative to start conditions. Wild-type and end3-1 mutant cells (LGY31, DAY28) were treated either with 50 mM Tris, pH 8, or by moving the culture from growth in the presence of 1 M sorbitol to conditioned medium without sorbitol. The number above the bar graph indicates the total number of Slm1-GFP structures counted in the control cells (= 100%; ∼50 cells analyzed). (C) Quantification of the Slm1-GFP distribution (cell surface/total) in LGY31 cells before and 15 min after the addition of 50 mM Tris, pH 8 (same data set as used for quantification in B). (E) Fluorescence microscopy of wild-type cells expressing Slm1-GFP and Avo3-mCherry (DAY53). The pictures show a projection of 10 optical sections (250 nm each) representing the bottom half of the cells. The bar graph represents the quantification of 30 cells, determining the number Slm1-GFP only, Avo3-mCherry only, and colocalizing structures per half-cell. The quantification was performed manually. Small structures >4 pixels were omitted.

