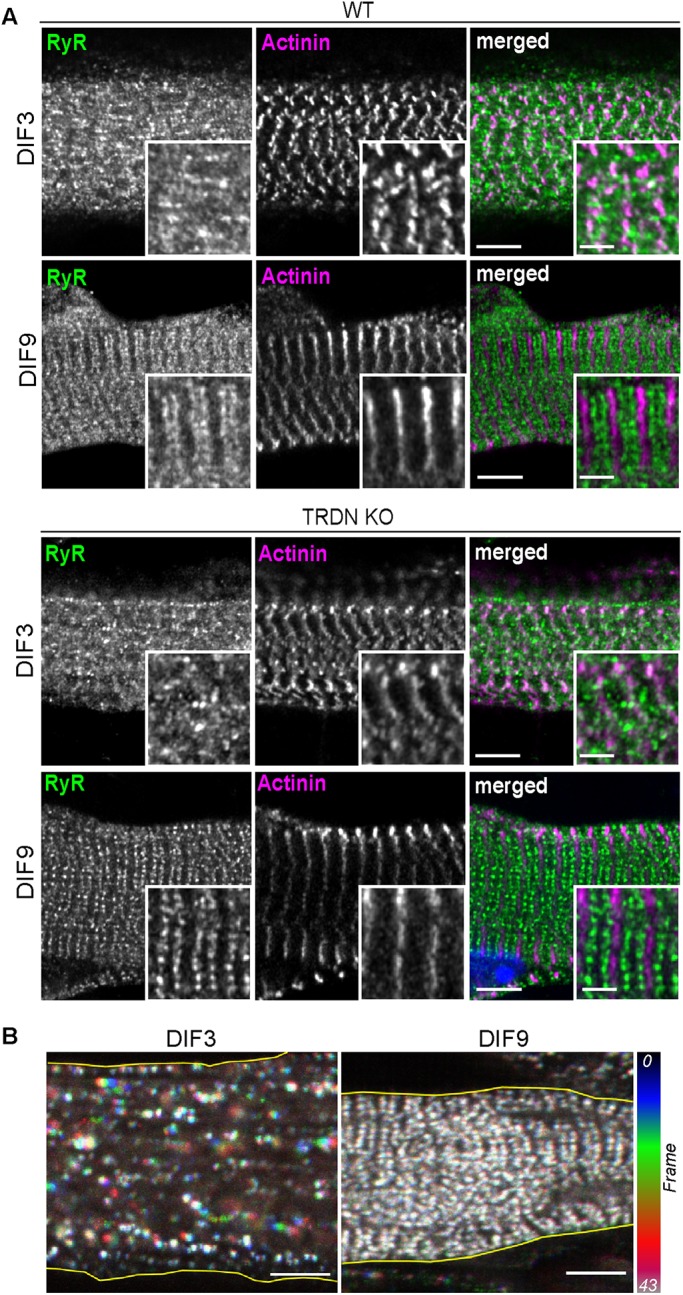
FIGURE 1:

Triad organization and T95 behavior. (A) DIF3 and DIF9 WT (top panels) and TRDN KO (bottom panels) myotubes labeled with anti-RyR1 (green), and anti–α-actinin (magenta) antibodies. Single confocal planes, scale bars = 5 μm. For each image, insets of triad and of Z-disks for general sarcomere organization assessment are shown. Scale bars = 2 μm. (B) Color-coded representation of 10.6-min movies (43 frames) of DIF3 (left) and DIF9 (right) myotubes expressing T95-GFP. T95-GFP movements (represented by colored clusters) are only observed at DIF3. Scale bars = 5 μm.
