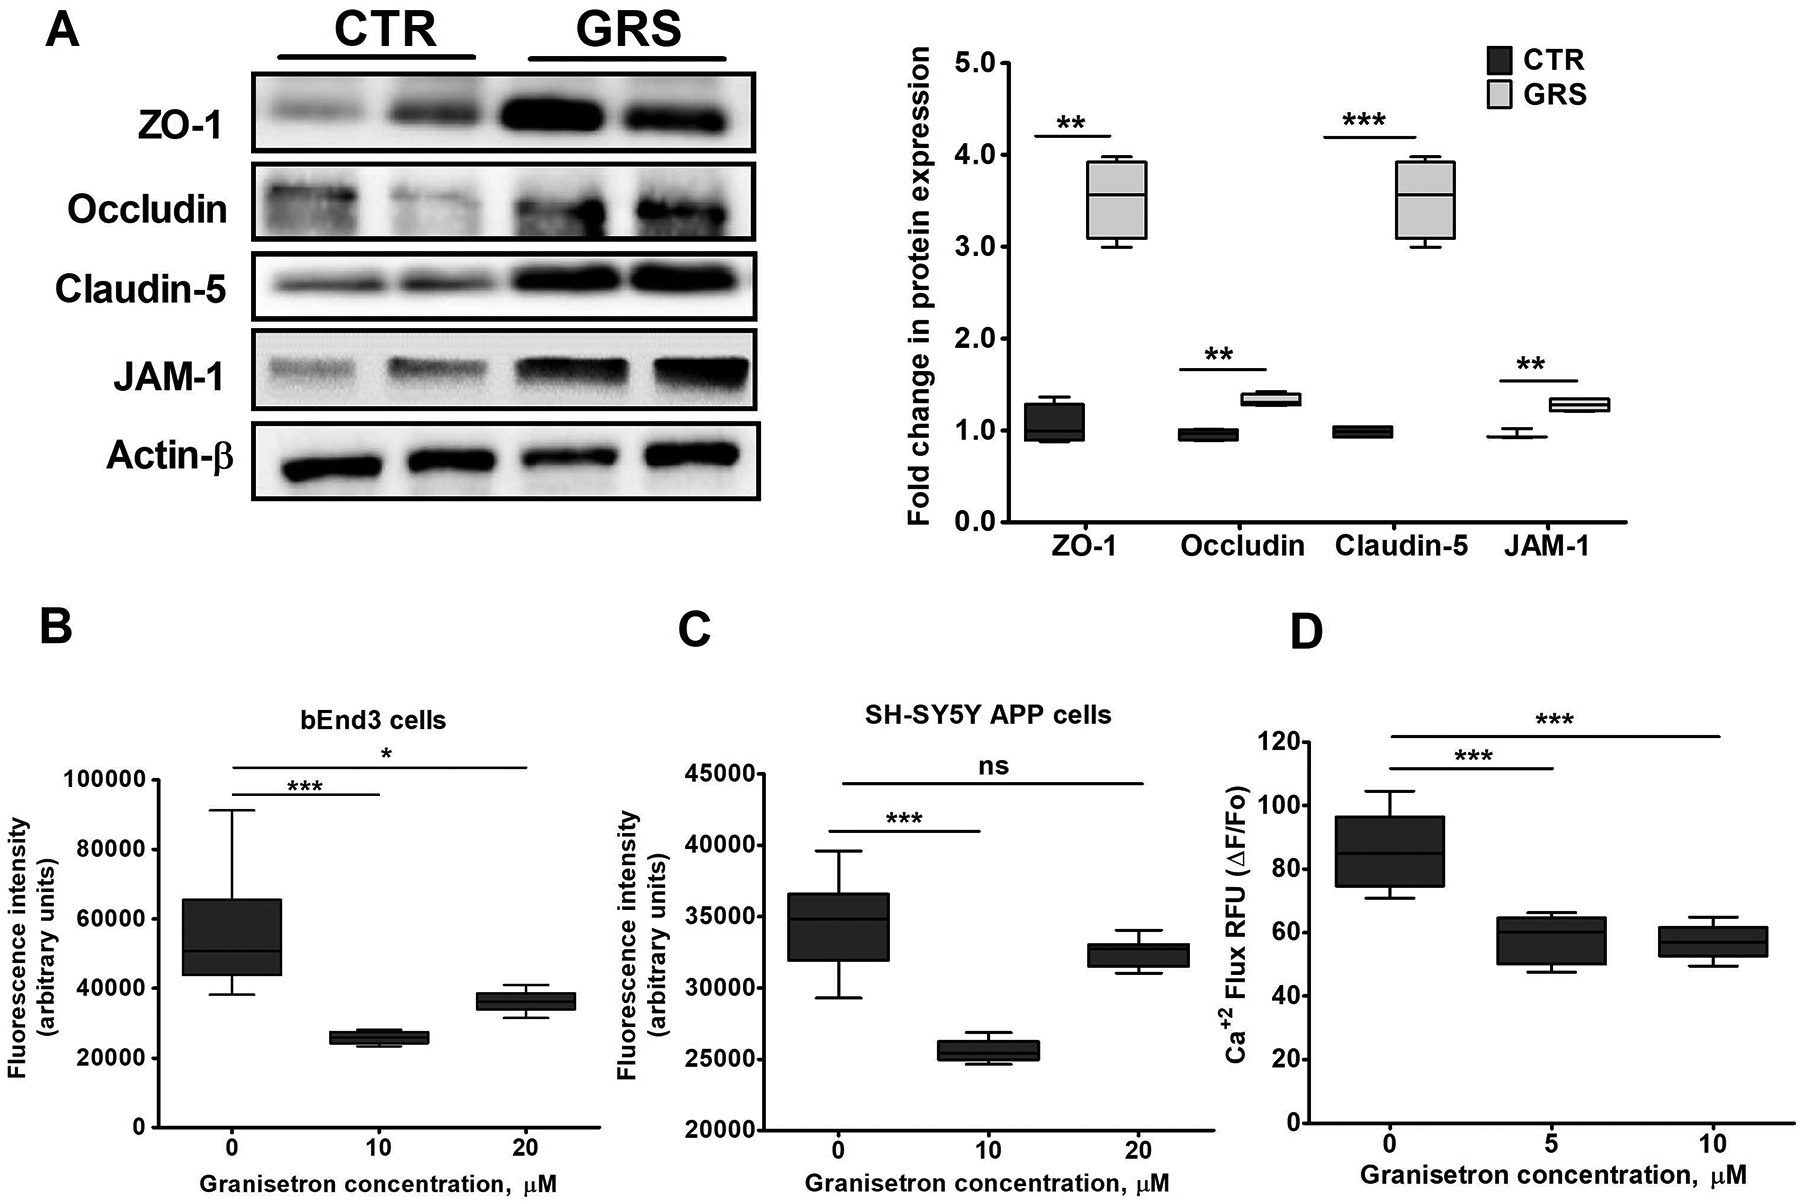
Figure 3. Granisetron (GRS) increased tight junction proteins in bEnd3 cells and reduced intracellular calcium levels in vitro.

(A) Granisetron (10 μM) treatment for 72 h upregulated the expression of tight and adherent junction proteins in bEnd3 cells as shown in the representative blots and their densitometry analysis. All values were normalized to CTR (1.0). (B) Comparison of the effect of granisetron on intracellular Ca+2 level measured using the Fluo-4 assay in (B) bEnd3 cells, and (C) SH-SY5Y-APP cells after 24 h treatment with 10 and 20 μM. (D) SH-SY5Y-APP cells were additionally pre-treated with granisetron 5 and 10 μM for 24 h and were then acutely exposed to freshly prepared Aβ42 (2 μM) to measure Ca+2 flux kinetics using Fluo-4 assay. Ca+2 flux assays were performed in HBSS buffer devoid of Ca+2 and Mg+2 to determine the source of Ca+2 moving into the cytosol. Each treatment was tested in a minimum of eight replicate wells per assay and the experiments repeated at a minimum of three times over separate days. Statistical analysis was determined by Student’s t-test for (A), and one-way ANOVA test for (B-D). Data are presented as box-and-whisker plots representing median and IQR, with minimum and maximum values. ns = not significant, *P < 0.05, **P < 0.01, and ***P < 0.001 versus vehicle treated cells (CTR, control).
