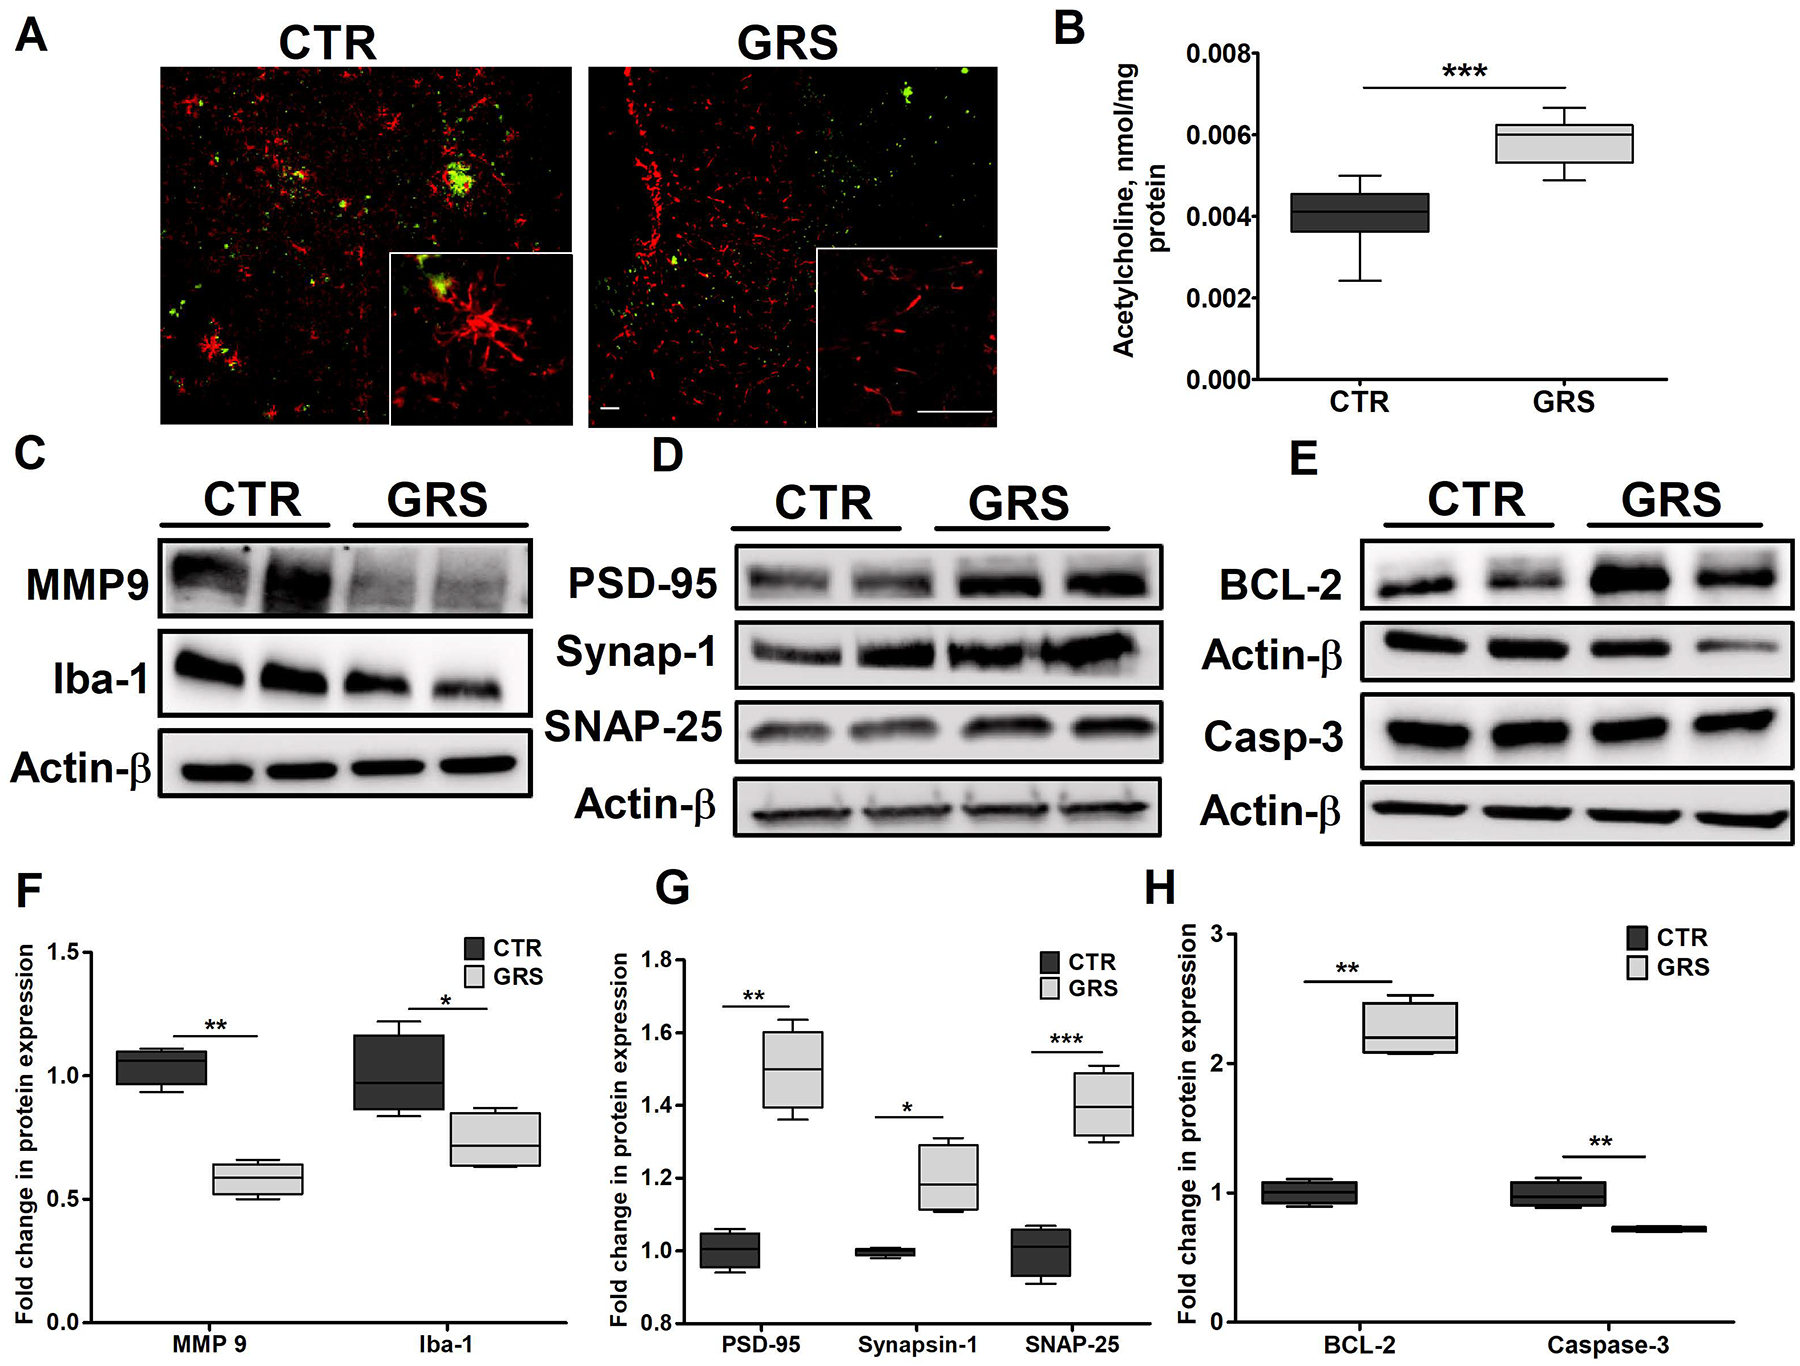
Figure 6. Granisetron (GRS) treatment reduced neuroinflammation, up-regulated neuro-synaptic markers, reduced apoptosis and increased acetylcholine levels in the brains of TgSwDI mice.

Neuroinflammation was assessed by measuring astrocytes activation monitored by astrocytes morphology, MMP-9 and the microglial marker Iba-1 expressions where granisetron treatment significantly reduced their levels. (A) Representative brain sections stained with anti-GFAP (red) antibody to detect activated astrocytes and 6E10 (green) antibody to detect Aβ in control (CTR) and granisetron (GRS) groups (seen at higher magnification in the closed inserts). Scale bar, 200 μm. Individual red and green channels for Panel A can be found under supplementary material (Fig. S4). (B) Acetylcholine level in the brain homogenates of both control and granisetron treated mice was measured using ELISA. (C) Representative blots, and (F) densitometry analysis of MMP-9 and Iba-1 in TgSwDI mice brains homogenates. (D) Representative blots, and (G) densitometry analysis of the neuro-synaptic markers PSD-95, Synapsin-1 and SNAP-25 in mice brains homogenates of TgSwDI mice. (E) Representative blots, and (H) densitometry analysis of the anti-apoptotic marker Bcl-2 and the apoptotic marker caspase-3 in brain homogenates of TgSwDI mice. Values were normalized to CTR (1.0). Data are presented as box-and-whisker plots representing median and IQR, with minimum and maximum values. Statistical analysis was determined by Student’s t-test (n=5 mice per group). *P < 0.05, ** P <0.01, and ***P < 0.001 versus vehicle treated (CTR) group.
